
Using the Device Characterization Wizard for a Power Diode
Details about the Power Diode Model are in the Basic Elements section in the Components help.
The following procedures use an Infineon device as an example. The process is similar for other manufacturers’ devices.
- Click Save Model at any time during the characterization process to save your progress.
- A characterization can be loaded on the Import Model tab.
- In the Component Information [1/8] dialog box, enter the component name, material, and junction type and define the manufacturer data.
- Material – Si and SiC Diodes are currently supported.
-
Junction Type – p-n junction or Schottky barrier diode (SBD). Note that almost all commercial SiC diodes are SBDs.
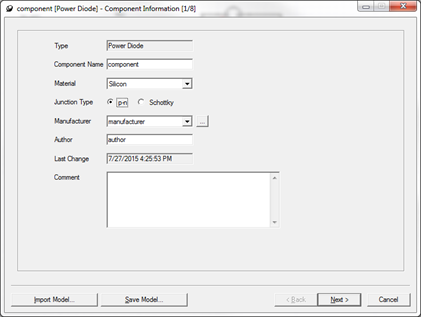
- Manufacturer Data – These are measurement criteria of dynamic characteristics defined by manufacturers. The information is usually found in the data sheet or device application note from the manufacturer. The documentation describes specific settings for several manufacturers. These are the measurement
conditions for the dynamic characteristics. For example, Infineon uses
the following settings:
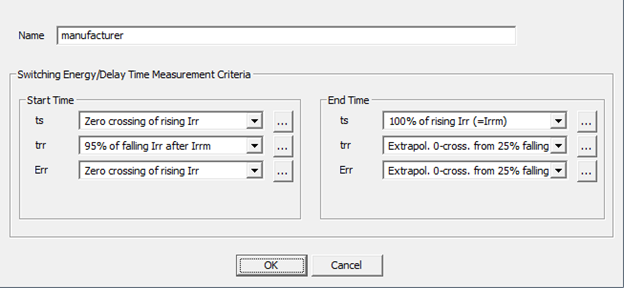
This manufacturer data is critical for the correct characterization of the device. Because each manufacturer uses its own standard to measure the diode reverse recovery parameters, if a dynamic measurement is included as fitting goal in [6/8] of the wizard, it is important to measure the quantity the same way during characterization, which fits the model to output the same.
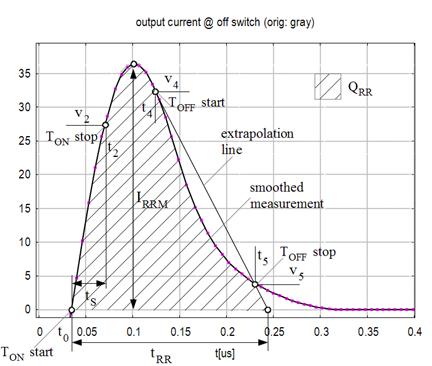
The most important setting in this dialog box is trr. It always starts at the current zero crossing point, while the end point is extrapolated on two helping points, t4 and t5 , as in the following figure. Enter t4 in the first input box next to trr and t5 in the second, according to the vendor’s specification. Qrr uses the same start and end time as trr.
The start and end times of ts and Err are often not specified by vendors. In this case, use the default settings for these two, as long as they are not included as fitting goals in [6/8] of the wizard.
- The Nominal Working Point Values [2/8] dialog box sets nominal values at the device’s working point. As mentioned above, these are ideally the operating conditions for the device in the design. Practically, these values should be the test conditions on the manufacturer's data sheet specified for the switching time and energy information obtained and used for dynamic parameters extraction. These are the conditions for which the parameterized device will best match the measured characteristics. For Infineon, generally pick the measurement conditions for the dynamic characteristics. Pick the values of VR, IF and diF/dt mentioned in the table next to the value of the reverse recovery time, trr. Select the temperature for which you have the forward characteristics in the plot’s section. Use the default breakdown characteristics, as the breakdown characteristics data is rarely available in a data sheet. Click Next to continue.
- Use the Diode Forward
Characteristic [3/8] dialog
box to parameterize the forward current characteristics of the
diode. Enter the data with SheetScan.
To do so, click Load characteristics from Dataset
Manager (
 ) above the table and click SheetScan.
Load the graphs in the graphic files captured from the manufacturer data sheet using Picture > Load
picture.
) above the table and click SheetScan.
Load the graphs in the graphic files captured from the manufacturer data sheet using Picture > Load
picture.
For an Infineon device, the data sheet plot shows IF=f(VF).
- Select a coordinate system (Coordinate System > New) and define it on the plot. To do so, you must select three points. Typically, you should use the bottom-right, bottom-left and top-right points of the plot grid. Click Point1, Point2 and Point3, and select the corresponding points on the graph. Enter the corresponding X-values and Y-values for these points (read from the plot’s X-axis and Y-axis labels) in the table, and click OK to finish defining the coordinate system.
- To define the first characteristic, select Curve > New, and give names to the X-axis and Y-axis in the Curve Settings dialog box. Click OK when finished.
- Make sure to note the temperature given on the plot. Then select several points on the curve starting with the lowest X-value. Pick at least four points. When done, click File > Export and click Dataset in the resulting Save dialog box.
- If a plot at a different temperature is available, repeat steps a, b, and c to record additional data.
- When finished, click File > Exit to exit SheetScan, saving the scan setup information if desired.
- In the Datasets dialog box, select the data to use at the nominal temperature and click Done. The data is transferred to the Characteristic Data table in the Diode Forward Characteristic [3/8] dialog box. Make sure to enter the correct values for temperature, which you recorded during the SheetScan measurements.
- If you also recorded plot data for
a different temperature, click Add new
characteristic (
 ) in the top right corner, and click Load characteristics from Dataset Manager (
 ) above
the table to load the additional data. Select the plot in the first tab
for the Nominal Temperature field
of the Fitting Characteristic Order
panel. If you added a second set of data for a different temperature,
you can select this plot for the Different
Temperature field, or select Not
Used, if data is available only for one temperature.
) above
the table to load the additional data. Select the plot in the first tab
for the Nominal Temperature field
of the Fitting Characteristic Order
panel. If you added a second set of data for a different temperature,
you can select this plot for the Different
Temperature field, or select Not
Used, if data is available only for one temperature. - Click Start Fitting to fit the characteristics and examine the resulting plot to check the match of the fit. Click Next to continue.
- Use the Diode Thermal Model [4/8] dialog box to parameterize the thermal impedance of the diode. Do one of the following:
- If the data sheet provides extracted values for ri and ti, enter these four value pairs in the Continued/Partial Fraction Coefficients table, click Start Fitting, check the plot, and click Next to continue.
- If the data sheet does not provide extracted values for ri and ti, select Use Transient Thermal Impedance, and enter the plot data for the thermal characteristics using SheetScan per the instructions given in step 3. The plot shows the impedance as a function of time. Make sure to adjust the scale of the coordinate system in SheetScan to logarithmic if needed. Select Start Fitting to start the fit, and examine the plot to check the match of the fit. Click Next to continue.
Sample the "single pulse" curve when multiple transient thermal impedance curves are presented in the data sheet.
- Use the Junction Capacitance Characteristics [5/8] dialog box to parameterize the diode junction capacitance vs. the reverse voltage.
If the data sheet provides junction capacitance vs. reverse voltage characteristics, clear Disable Cj Characteristics, and enter the junction capacitance data with SheetScan per the instructions given in step 3. Select Start Fitting to start the fit and examine the plot to check the match of the fit. Click Next to continue.
For Schottky barrier diodes, when Schottky is selected for the junction type, this characteristic is crucial for correct dynamic behavior.
- Use the Dynamic Model Input [6/8] dialog box to parameterize the dynamic characteristics of the power diode. Select to fit for the reverse recovery charge (Qrr) and time (Trr). The nominal point has to be fit, so the data must be available. The Advanced Settings button allows for more control over the characterization process, but it should not be necessary to change for most devices. Check the Advanced Settings documentation for more information.
- Click Measurement to open the Measurement Data dialog box, and make sure the settings correspond to the ones for the manufacturer of the device being characterized.
- If data is available at different temperature, add it to the dT row.
- If data is available at a different value of current IF, add the lower value of current to the nI row and the higher value of current to the pI row.
- If data is available at a different value of current rate of change diF/dt, add the lower value of diF/dt to the nX row and the higher value of diF/dt to the pX row.
- Click Extraction to start the fit and click Next to continue.
- H_ON - On-switch signal acquisition time
- H_OFF - Off-switch signal acquisition time
For low and medium power devices, the default settings should be sufficient to ensure correct data measurement. For high power devices, the H_ON and H_OFF values might be increased (2-5 times).
- The parameter extraction process uses three optimization routines to determine values for the dynamic device parameters. The first routine is an iterative loop that uses a 1D search method to progressively refine its approximation. To enable it, set LOOPS_A to an integer number larger than 0 (zero). MASKPAR_A contains the names of the optimization parameters to reach a good convergence. RESORD_A sets how the residue is defined: 0 (zero) for the maximum error, 1 for the average error, and 2 for the root mean square error. RESTOL_A defines the value under which the residue must get to leave the loop with a good solution.
- The second and the third loops (B and C) use a Jacobian matrix method. LOOPS_B and LOOPS_C set the number of pre-loops which are taken for the second and third loop: usually 1 should suffice. MASKPAR_B and MASKPAR_C contain the names of the parameters changed by the characterization tool to find a better fit during the second and third loops. MATRIX_B and MATRIX_C set the maximum number of Jacobian recalculations, while ZEROFN_B and ZEROFN_C set the maximum number of constant Jacobian calculations. RESLOC_B and RESLOC_C set the maximum number of relaxations that occur within a constant Jacobian calculation. RESORD_B and RESORD_C set how the residue is defined: 0 for the maximum error, 1 for the average error, and 2 for the root mean square error. RESTOL_B and RESTOL_C define the value under which the residue must get to leave the second and the third loops with a good solution. If it is zero, it gets this value from the worksheet
- Use the Dynamic Parameter Validation [7/8] dialog box to validate the dynamic extraction. The actual values of the switching times and energies for the parameterized device will be calculated. Enable the conditions that need to be checked and click Validate. Click Next to continue.
- Use the Model Parameters [8/8] dialog box to browse the extracted parameters.
- To generate an .sml file of the model, click Create SML.
- To place a characterized device in the Twin Builder project, click Place Component and click Finish.
- To generate a test circuit using the characterized device, click Testcircuit and click Finish.
The generated test circuit contains an RC snubber circuit. The RC values are calculated by the following equations:

and
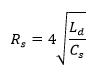
in which  is the zero voltage junction capacitance of the diode, with parameter name C0_JNCT in the diode model;
  is the inductor in the same test circuit which is calculated based on specified
  .
.