
Field Overlays in Q3D Extractor and 2D Extractor
Field overlays are representations of basic or derived field quantities on surfaces or objects for the current design variation.
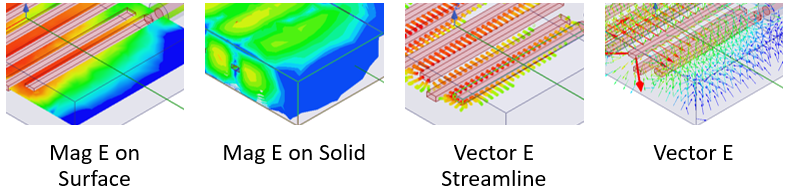
See the examples below:
Adding Field Overlays
The general process for plotting a field overlay is:
- Select a geometry (point, line, plane, cutplane, surface, object).
- In the Project Manager, right-click Field Overlays.
- Select [Solver] Fields > [Desired Field].
Important:
- You must have selected Save Fields in the solution setup in order to enable the Plot Fields selections.
- The available options depend on the design, the selected geometry, and solutions.
The Create Field Plot window appears.

This window contains the following options:
- Specify Name – choose a name for the field overlay, or leave the default.
- Specify Folder – select the folder under which the overlay will appear in the Project Manager. All field plots under a folder share the same color key.
- Category – from this drop-down menu, select either Standard to use standard quantities or Calculator and click Fields Calculator to specify calculated quantities.
- Context – select the Solution, Field Type, and Intrinsic Variables to alter the available quantities in the Quantity list.
- Quantity – list of either Standard quantities or Calculator quantities, depending on the Category selection.
Note:
- If you select a point for the Geometry and a Category that is a named expression based on the point (or other scalar, non-3D value), then the Quantity list only lists expressions that return a single scalar value. If you have added named expressions that take the magnitude of the ScalarX(), ScalarY(), or ScalarZ() of a vector point value, then you can create output variables for those expressions only in this case.
- If you select a polyline for the Geometry and a Category that is a named expression based on the line, then the Quantity list only lists corresponding expressions. The list will not contain scalar values when a line is selected as the geometry.
- In Volume – enables you to limit plots to the intersection of a volume with the selected object or objects. You can select and deselect any items in the In Volume list. You can mix model objects with non-model boxes. For example, you might want to see a plot from part of two model objects by restricting the region to a non-model box overlapping those parts.
- Plot on surface only (Q3D Extractor only) – select to plot on the surface only. Selecting this option also enables the Surface Smoothing button, from which you can enable Gaussian smoothing.

- Plot on edge only (2D Extractor only) – select to plot on the edge only. Selecting this option disables the Surface Smoothing button.
- Streamline – select to display the overlay as streamlines. These are often used to indicate magnetic flux lines, etc.
- Select the desired options and click Done.
- The field overlay appears under Field Overlays in the Project Manager.
Viewing Field Overlays
Once you have added a field overlay, control its visibility by right-clicking it and selecting or deselecting Plot Visibility.

Alternately, navigate to View > Visibility > Active View Visibility to open the Active View Visibility dialog box. The Fields Reporter tab lists all field overlays in the design and you can select and deselect their Visibility.

Modifying Field Overlays
To modify a field overlay, right-click it in the Project Manager and select Modify Plot.
The Modify Field Plot window appears, with the same options as the Create Field Plot window.
Make the desired changes and click Apply.