
Viewing Analysis Results for Optimetrics Solutions
To view data specific to an Optimetrics solution, in general, do the following:
- In the Project Manager tree, right-click the Optimetrics setup for which you want to view the results, and then select View Analysis Result.
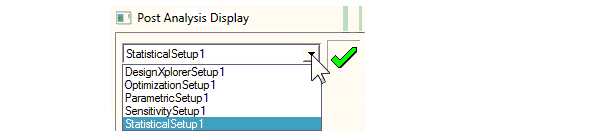
- Select from available setups by using the drop-down selection menu.
- Select the Result tab to view results in plot or table form. When you view results in Table form you can resort the results based on each column. For example, click the Variation column head to invert the sort from lowest to highest setup number. Click the variable name column to resort the results by step value. Click the Cost column head to sort the results from lowest cost to highest cost. Clicking a column again inverts the current sort.
- Click the Options button to open a dialog that permits you to specify the Maximum number of significant digits to display when showing the analysis result. The default is 4.
- Select the Profile tab to view start, stop, and elapsed times for each variable, and the analysis machine for each variation. You can click the column heads to sort the table by variation number,variable value, start, stop, or elapsed time, or (if you have run a distributed analysis) machine.
The Post Analysis Display dialog box appears.
See the help topics in this section for more details about viewing optimization analysis results.
Related Topics
Viewing Solution Data for an Optimetrics Design Variation
Viewing an Optimetrics Solution's Profile Data
Viewing Results for Parametric Solution Quantities
Viewing Cost Results for an Optimization Analysis