Generating Reports For Characteristic Mode Analysis
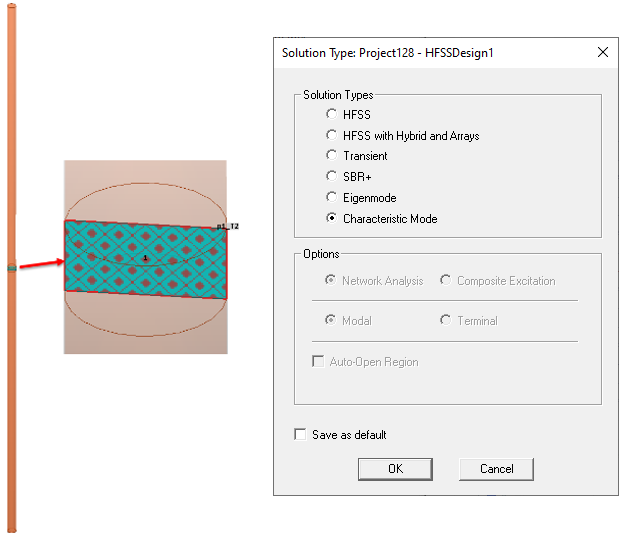
This section describes how to use the characteristic mode analysis feature in HFSS when designing an antenna and generating characteristic mode analysis reports. The section also covers post processing capabilities available in HFSS when using CMA. To illustrate post processing for characteristic mode analysis, we will use a dipole antenna example. The two conducting arms of the dipole antenna are excited by a lumped port. From the menu item HFSS > Solution Type, define Characteristic Mode as the solution type.
Define the adapt frequency and characteristic mode parameters on the CMA Solution Setup dialog box. For Characteristic Modes solution types, these include the following:
- Solution Frequency
- Maximum Number of Passes
- Maximum Delta E
- Minimum Modal Significance, a measure of how significant a mode is for solving the EFIE at a given frequency. It also determines how hard or how easy it is to excite a mode.The default for Minimum Modal Significance is 0.02. All the modes that are above this value 0.02 are calculated.
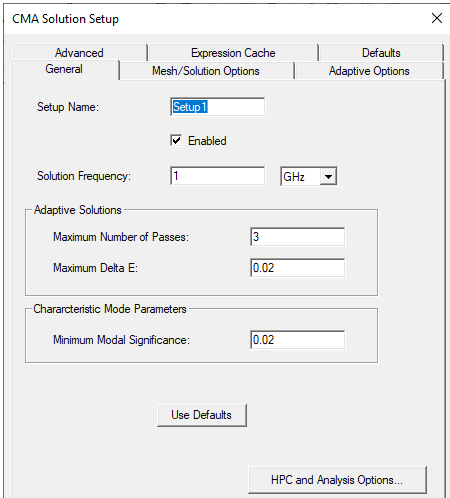
For this design the adapt frequency is set to 1.6 GHz. It’s recommended that you define the adapt frequency to be the highest frequency in the discrete sweep.
After the simulation of the dipole antenna is complete, you can view the number of modes above the minimum modal significance, their characteristic angles, and characteristic values at every frequency in the Solution Data dialog box. To bring up this dialog box, right-click Results in the project tree and select Solution Data from the shortcut menu. The characteristic mode quantities are displayed in the CMA Data panel.
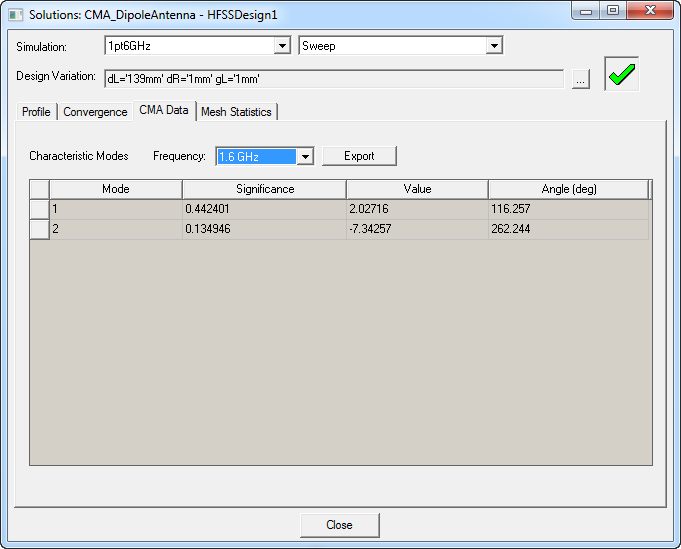
From the Frequency drop-down menu, select the desired frequency view all the quantities for the characteristic modes. As an example, at the adapt frequency of 1.6 GHz, there are two modes in this dipole antenna above the specified minimum modal significance.
For these two modes:
- Modal Significance MS1= 0.442401 and MS2 = 0.134946 at 1.6 GHz
- Characteristic angles α1= 116.257 degrees and α2= 262.244 degrees.
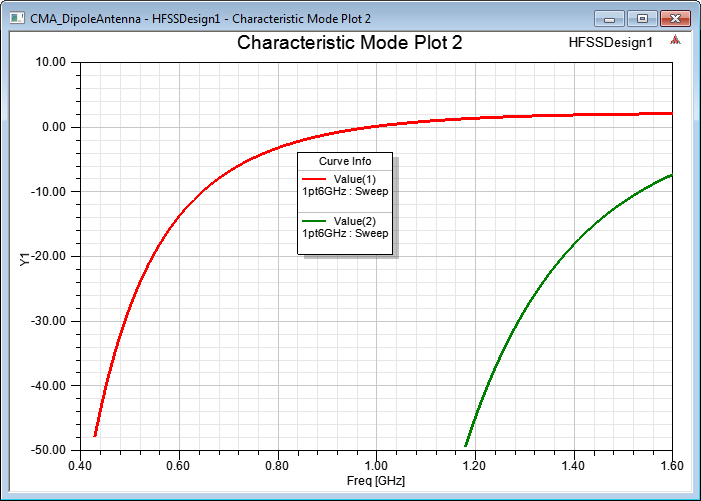
- Characteristic values λ1=+2.02716 and λ2= -7.34257.
From these values, you can infer that mode 1 is inductive and mode 2 is capacitive.
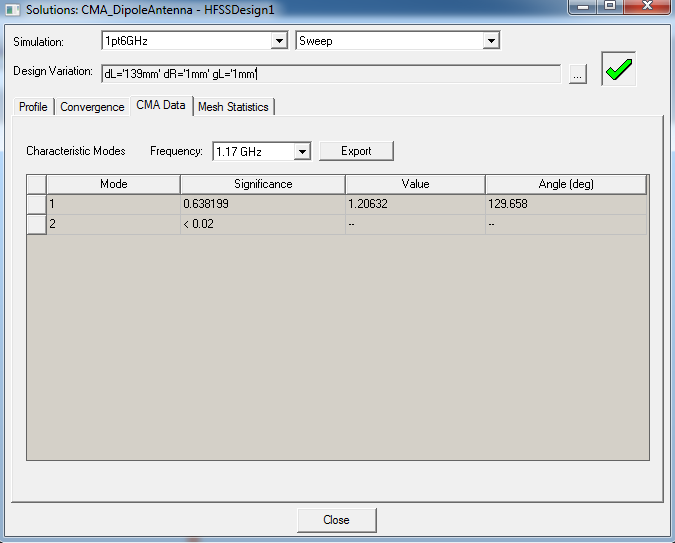
As you choose lower frequencies, significance of mode 2 reduces and MS2 approaches a value less than 0.02. At 1.17 GHz, only mode 1 is significant and above 0.02.
Characteristic Mode Data Report
The process for generating Characteristic Mode Plots for each of these quantities is as follows:
-
Check the maximum number of modes for a design from the CMA Data panel at the highest frequency.
-
Right-click Results > Create Characteristic Mode Data Report > Rectangular Plot, use the Results tab of the ribbon, and select from the Characteristic Mode Data Report menu and select the Rectangular Plot icon to open the Report dialog.
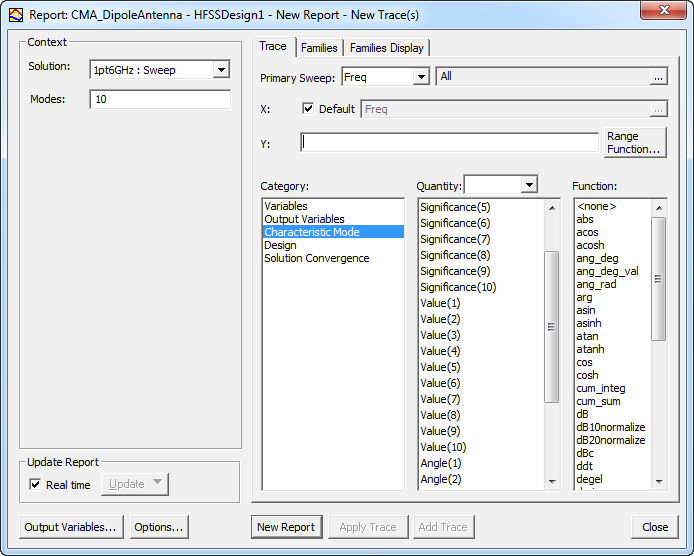
-
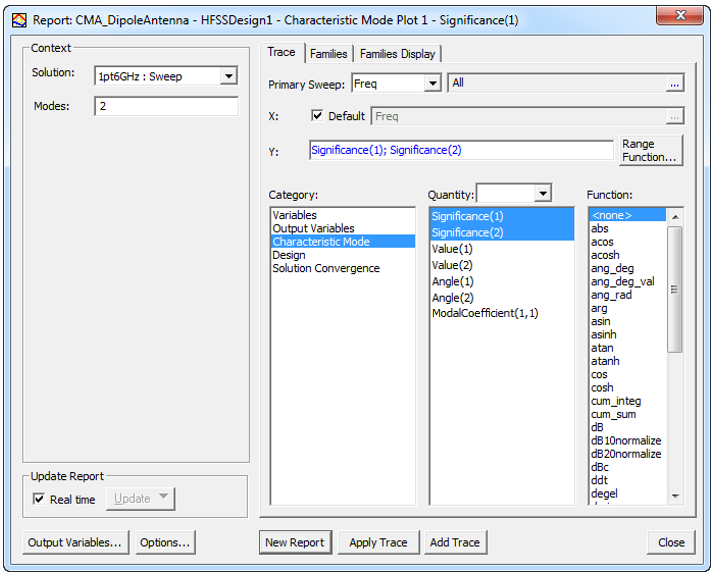
In the Context panel the number 10 in the Modes field is the default. You can either leave this value as is or change it to the maximum number of modes that are above the minimum modal significance. For this dipole antenna, the Modes field is set to 2 since there are only two modes at the adapt frequency as displayed in the CMA Data panel.
-
Ensure Characteristic Mode is selected in the Category and then select the Quantity of interest (Significances, Values, and Angles of the desired modes) and leave the Function as none.
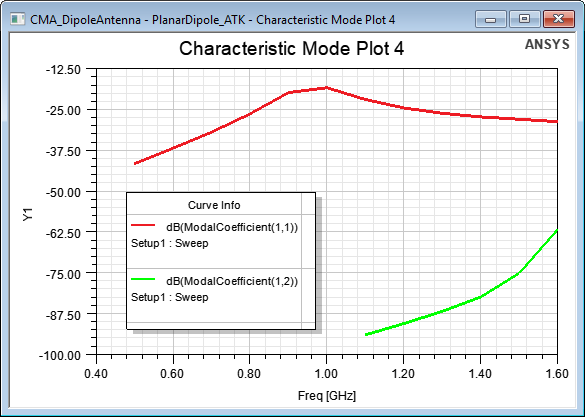
For CMA problems, you can also plot the Modal Coefficients. For Plotting Modal Coefficients, you must select a Function. These quantities are named "ModalCoefficient(<port>,<mode>) where <port> contains each of the names of the ports in the design and <mode> runs from the number of modes from 1 through N-1 modes where N is the number of modes specified by the user. The solution from a given port excitation is represented as a linear combination of the modal solutions.
The modal coefficients are the quantities which we multiply the modal solutions to obtain the port solution.
The plots with their corresponding quantities of the characteristic mode are displayed here.
Modal Significance vs Frequency
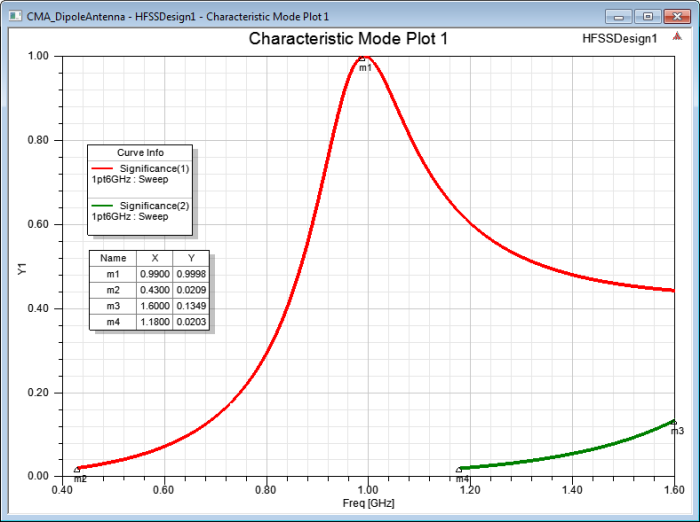
For this antenna, mode 1 radiates the most at 0.99 GHz and its Significance is 0.9998. Mode 2 radiates most efficiently at 1.6 GHz and its its maximum modal significance 0.1349.
Characteristic Value vs Frequency
Characteristic Angle vs Frequency
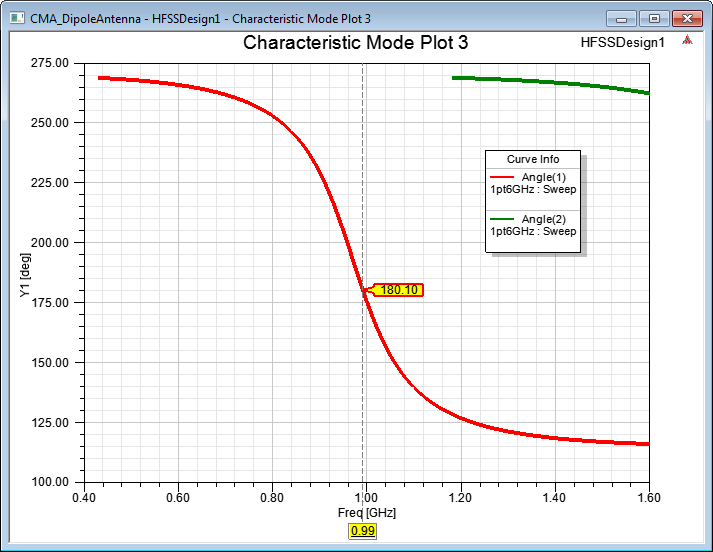
The character angle for Mode 1 is 180 degrees, when it becomes resonant as shown in the above plot.
Modal Coefficient Plot