SheetScan Menus and Settings
In the SheetScan window, various menus and toolbars allow you to access SheetScan functionality.
The top menu bar contains the following submenus:
- File – allows you to open, close, save, and print files.
- Edit – provides access to cut, copy, and paste functions.
- View – allows you to select which toolbars appear in the SheetScan window (see below).
- Options – provides access to document settings.
- Picture – provides options for loading a picture or HTML file into SheetScan, and for deleting a picture.
Note:
The Delete action cannot be undone. If you delete a picture from the SheetScan editor, you must reload it from the source file or Internet web page.
- Coordinate System – provides options for creating and editing a coordinate system.
- Curve – provides options that allow you to define a curve.
- Window – provides options for rearranging the currently open SheetScan windows (for example, overlapping and tiling).
- Help – accesses the Electronics Desktop online help.
SheetScan View Options
You can toggle the following toolbars via View > Toolbar:
- Standard – provides access to basic functions such as file Open and Save, Cut, Copy, Paste, Print, and Help.

- Curve – contains a drop-down menu allowing you to select a curve and tools for working with curve values.

- Zoom – provides tools for scaling the current view.

From the View menu, you can also toggle the following:
- Status Bar – displays, at the bottom of the screen, the current cursor coordinates.

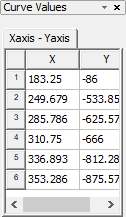
- Curve Values – dockable window that displays the data points used while creating a characteristic curve.

- Grid – displays the coordinate grid you created over the sheet.
SheetScan Right-click Menu
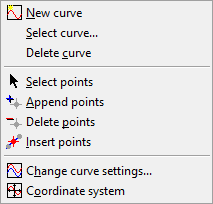
Once you have loaded a sheet, you can right-click in the SheetScan window to access curve and coordinate system options:

SheetScan Settings
Default settings can be changed from Options > Settings.
The Settings dialog box contains three tabs:
- Document – allows you to set the width and height of the sheet created when a picture is imported. You can either enter the dimensions manually, or allow SheetScan to adapt the dimensions to the picture being loaded.
- Axis – allows you to set the name, units, scaling, and offset for the X and Y axis. You can also select Monotonicity in X to prevent adding consecutive data points whose X-values are not increasing.
- Representation – allows you to choose whether to connect points on the characteristic curve and to choose the connecting line color. You can also decide whether to display markers and choose marker colors.
You can also override the default settings on the Axis and Representation tabs for individual curves (See: Defining a Characteristic Curve in SheetScan).
