
Viewing Convergence Data
To view an adaptive solution's convergence information, either during or after the solution process:
- In the project tree, right-click the solution setup of interest, and then click Convergence on the shortcut menu.
The Solution Data window appears. The Convergence tab is selected. You can also select the Results tab of the ribbon, click the Solution Data icon, and click the Convergence tab when the Solution Data window appears.
- If you have run multiple simulations, from the Simulation list, select the solution setup for which you want to view convergence data.
By default, the most recently solved solution is selected.
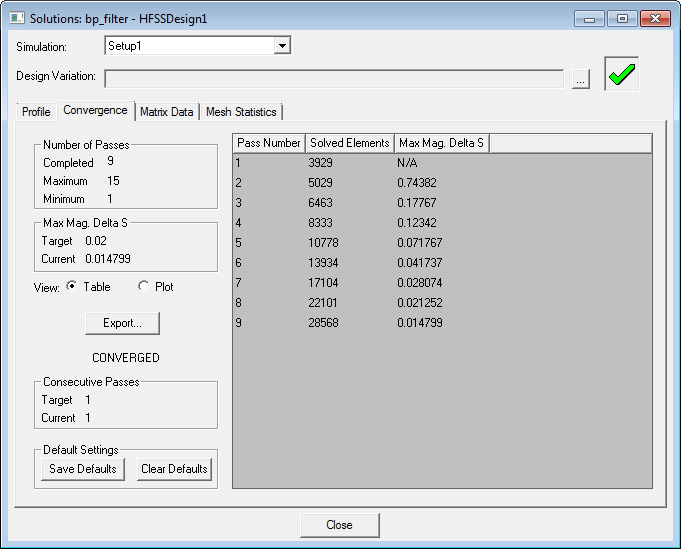
- Under the Convergence tab, depending on your design setup, you can review the following convergence data:
- Whether the solution is converged or not converged.
- Number of adaptive passes completed and remaining.
- The Solved Elements at each adaptive pass, which includes solve inside tetrahedra, and, for projects using IE Regions for metal objects, also includes the number of solved IE surface triangles.
- Maximum magnitude of delta S between two passes.
- Maximum delta Energy between two passes.
- Magnitude margin between passes.
- Phase margin (deg) between passes.
- Maximum delta frequency between passes.
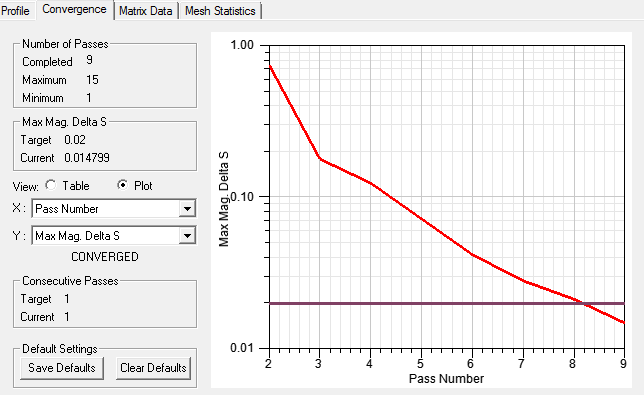
- Select Table
to display the convergence data in table format or Plot
to plot
the convergence data on a rectangular (X - Y) plot.
- If you select Save Defaults, the settings
for Table vs. Plot, and for Plot, the X and Y axis selections, those
settings apply, based on the design-type, each time you open the desktop.
You can also select Clear Defaults to reset to the original settings.
Note:
If you receive a message that the eigenmodes have not converged, it may indicate that the existing mesh is too coarse. You may need to refine the mesh.