Analyze and View the Optimization Results
Right-click the Optimization Setup to view the short-cut menu and click Analyze to start the simulation. Then right-click again, and select View Analysis Result to view the Post Analysis dialog box. Select the Plot radio button to watch the progress of the simulation.
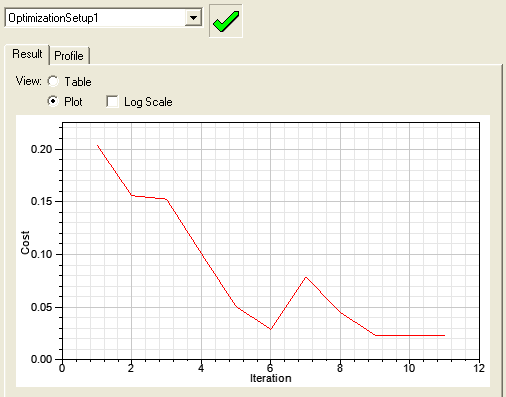
The plot form of the results shows how the Optimization search progresses toward the lowest cost.
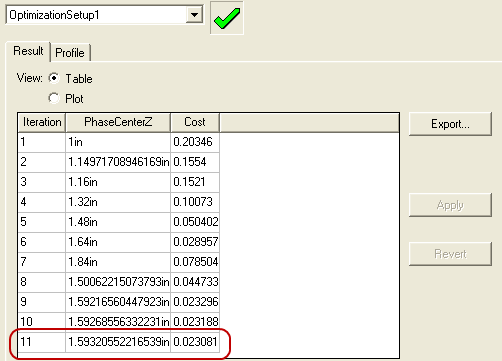
The table form of the Results shows that the Z coordinate of the phase center is the value of the post processing variable when Cost is at minimum.