Exercise 6: Create a bubble chart
Add attributes to both axes to create a bubble chart.
-
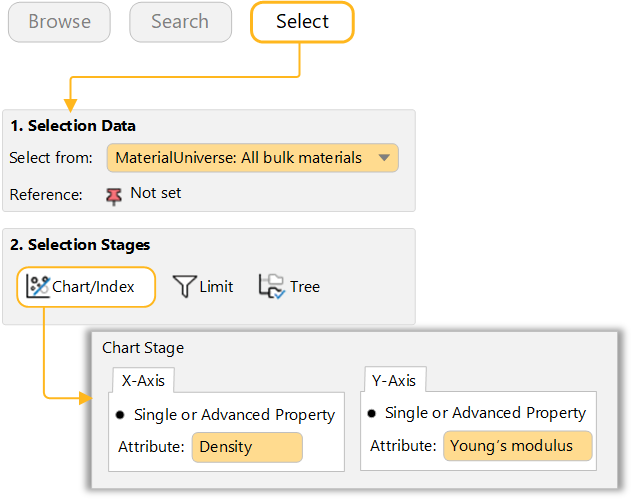
Make a bubble chart plotting Young’s Modulus (E) against Density (ρ)
Under Selection Stages, click Chart/Index.
Set the y-axis to Young’s modulus and set the x-axis to Density.
Use the Axis Settings defaults to create a log-log plot.
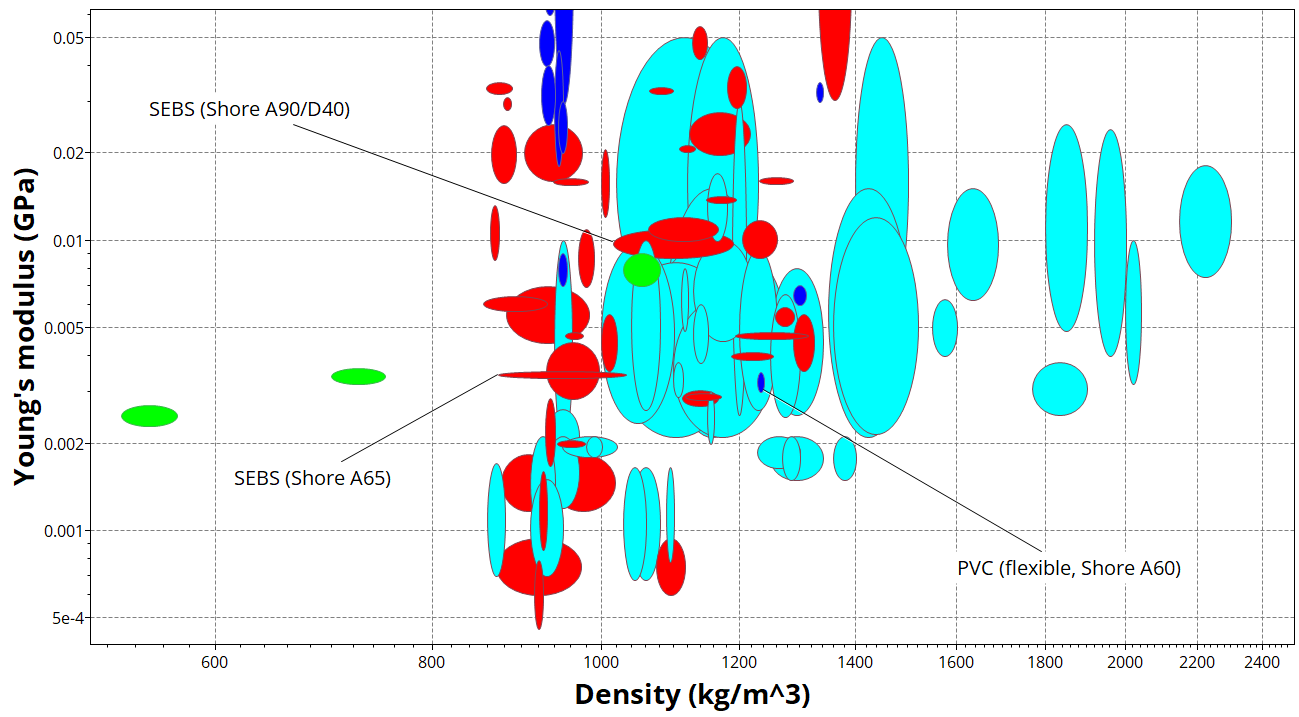
Bubble chart showing Young’s modulus (E) plotted against density (ρ)
-
Show family envelopes
Click
 to look at how data for a given family of materials
cluster together.
to look at how data for a given family of materials
cluster together. -
Label records on the chart
 Zoom in and label some records (click a
record and drag).
Zoom in and label some records (click a
record and drag).Try adding labels from the Results list: right-click a record in the list, select Label on the shortcut menu, and then drag the label to where you want it on the chart.
If the new label isn’t visible at the current zoom level, click
 Autoscale to display the whole chart
again.
Autoscale to display the whole chart
again. -
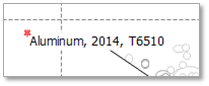
Locate the reference record on the chart
Click
 Highlight reference record on
the Chart Stage toolbar. All records except the reference record are grayed out.
Highlight reference record on
the Chart Stage toolbar. All records except the reference record are grayed out.
Label the reference record. Note that the label includes a special reference record indicator: