


Exercise 5: Create a bar chart
Plot materials data on a bar chart using the Chart/Index Stage.
-
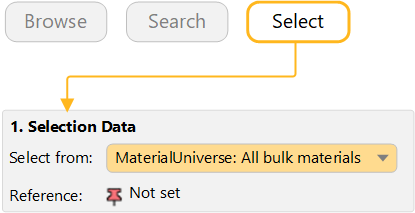
Select MaterialUniverse: All bulk materials on the
Chart/Select tab
-
Make a bar chart of Young’s Modulus (E)
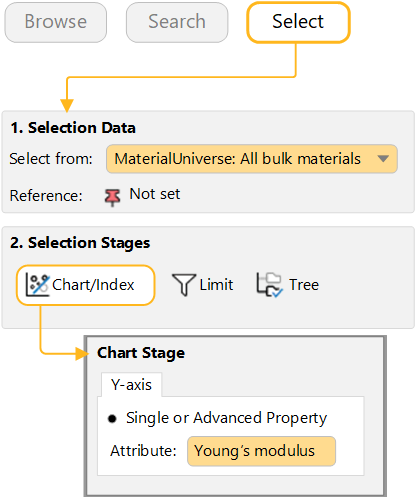
Under Selection Stages, click Chart/Select.
Set the y-axis attribute to Young's modulus, then click OK. (You can click on the Attribute field and start typing the name to quickly find and select the Attribute you are interested in.)
For a bar chart, you do not set an x-axis, so leave x-axis set to <None>.
-
Explore the chart
Click
 Zoom in and then drag to
zoom in on an area of the chart.
Zoom in and then drag to
zoom in on an area of the chart.Click
 Zoom out to zoom out.
Click
 Autoscale to zoom back to
view the whole chart again.
Autoscale to zoom back to
view the whole chart again. -
Label records on the chart
Click a record in the chart and then drag to add and position a new data label.
To delete a data label, select it and press DELETE. To delete all labels in the chart, press CTRL+A and then press DELETE.
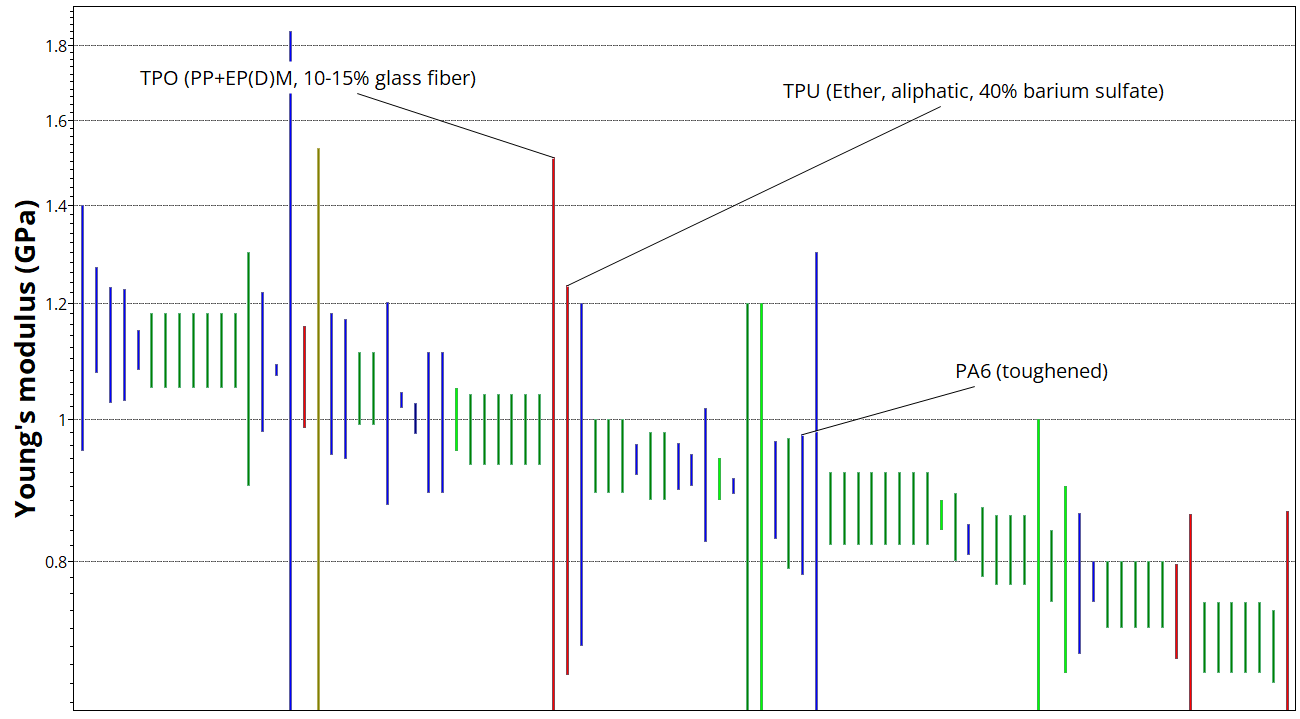
Labelled bar chart of Young’s modulus