


Exercise 4: Selection with a Trade-off Plot
You can use a trade-off curve in selection projects where there are conflicting objectives.
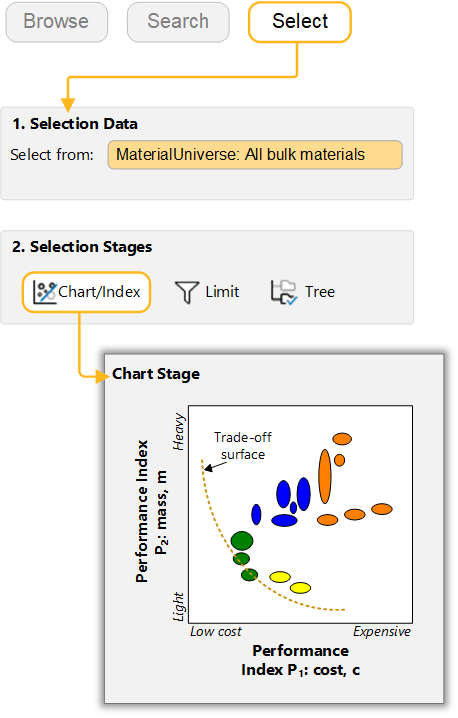
Many designs require a compromise to be made between competing objectives, for example, maximizing performance and minimizing cost. The influence of this ‘trade-off’ on material choice can be studied by generating a trade-off plot, where candidate materials lie along a hypothetical curve or trade-off surface. You can identify optimal materials for a particular application by making a judgment on the relative importance of the two objectives (for example in aerospace, high performance is more important than low cost).
-
Make a bubble chart of the performance index for a strength-limited Beam in
bending
Set the y-axis to optimize mass and the x-axis to optimize cost.
-
Create a trade-off curve by adding a curve annotation to the chart
On the Chart toolbar, click
 Curve.
Click the chart at the points you want the curve to pass through, then press Enter to finish editing the curve.
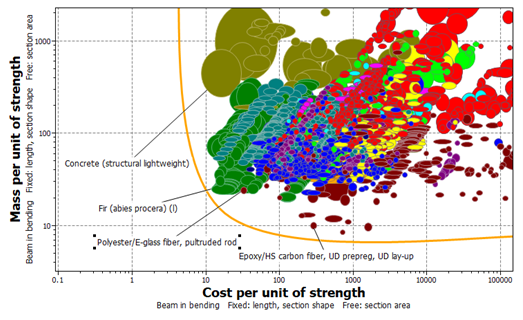
The curve is a guide to the eye, and does not perform selection. The materials closest to the trade-off curve offer the best compromise for minimizing mass and cost.