Exercise 2: Plotting a combined property
You can plot an attribute expression on a chart axis to compare two complex requirements on one selection chart.
Many engineering applications require combined properties to be optimized. For example, specific stiffness (Young's modulus / density) in aerospace and thermal diffusivity (thermal conductivity / (density * specific heat)) in thermal applications. You can plot these types of properties using the Advanced property feature.
-
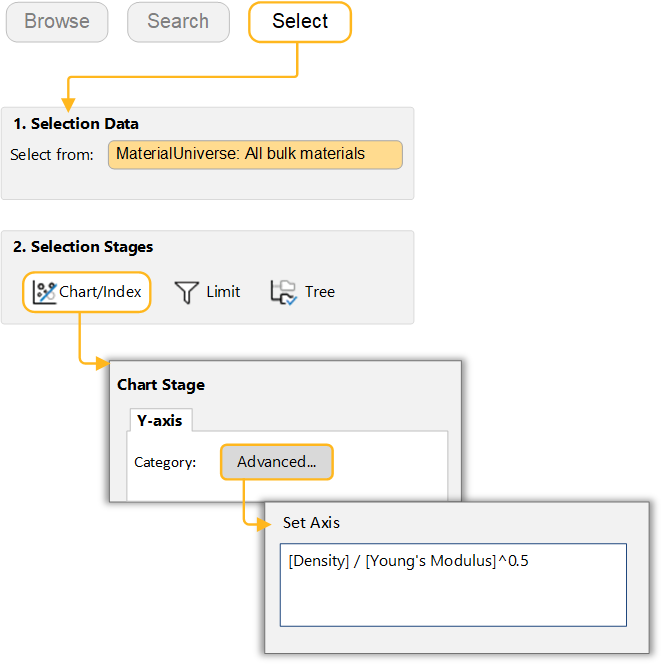
Make a bar chart of the combined property Density / (Young’s
modulus)1/2
In the Chart Stage dialog, next to the Category drop-down, click Advanced. In the Set Axis dialog, select an attribute and click Insert to build the expression.
You can also type directly into the text box: [Density]/[Young's modulus] ^ 0.5.
Leave the x-axis with no attribute set to generate a bar chart.