
Ray Statistics for SBR+ Analysis
Ray statistics summarize the ray tracing performed during the SBR+ simulation. Ray statistics are primarily useful for understanding the role of multi-bounce, UTD, creeping-wave, and other geometrical-optics mechanisms in the simulation. They are also useful for understanding the run time of SBR+ simulations, especially in the context of penetrable surfaces that lead to many split rays.
Ray statistics are found in the profile after an SBR+ run. Ray statistics are reported cumulatively for all Tx antennas in the simulation. Ray statistics appear under two different task names, with “SBR Ray Stats” reserved for SBR+ and "CW Ray Stats” reserved for Creeping Wave.
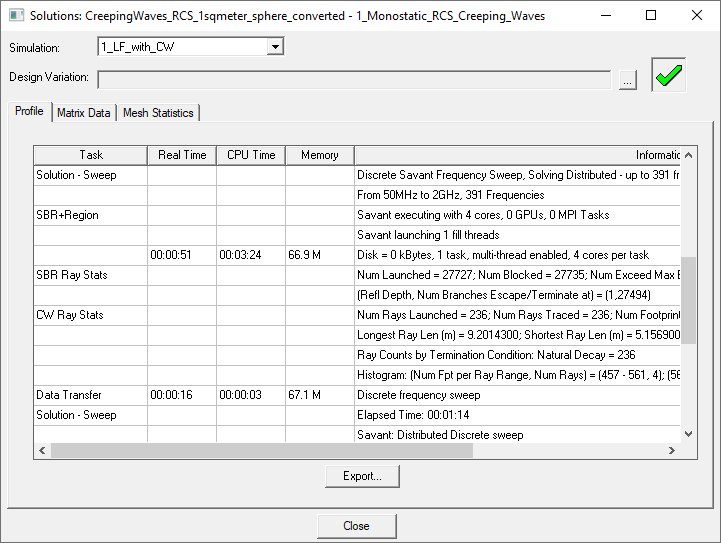
In the following, SBR and creeping-wave ray statistics are explained separately in more detail.
SBR Ray Stats
An SBR ray track is a sequence of connected ray segments (bounces). When a ray hits a surface, a reflected ray is generated, extending the track. If the surface is penetrable on a two-sided Layered Impedance Boundary or a face on dielectric solid object, a transmitted ray is also generated. This is called a split, leading to a new branch of the original ray track. On models with no penetrable surfaces, each ray track has only a single branch. On models with penetrable surfaces, each track may consist of 1 - N branches. If UTD rays are enabled for the simulation, the number of UTD rays are also listed.
Num Launched: Number of (non-UTD) rays illuminating the CAD model from the antenna, not including those blocked by other surfaces
Num Launched (UTD): Number of UTD rays illuminating the CAD model, not including those blocked by other surfaces
Num Blocked: Number of potentially launched rays whose line-of-sight path was blocked by part of the CAD model
Num Split: Number of rays that hit a penetrable surface. These rays are split to form both a transmitted and reflected ray
Num Exceed Max Bnc: Number of rays that would have continued propagating through the model, but were terminated because they reached the Max Number of Bounces limit set in the project
Num Absorbed: Number of rays that hit a surface coated with a perfect absorber. Ray track branches terminate on such surfaces.
Num Escaped: Number of ray track branches whose final ray escapes the scene
Num Contributed: Number of ray track branches that contributed to the scattered field
Num Invalid Interface: Number of rays that encounter volume interface inconsistency.
SBR ray histograms on the SBR ray track are also reported. The histograms are reported as pairs of number, with the first number being the Reflection or Transmission Depth followed by the number of branches that are terminated or escaped at that depth. For example,
(Refl Depth, Num Branches Escape/Terminate at) = (1,18353)
means 18353 branches are terminated or escaped after 1 reflection.
CW Ray Stats
If Creeping Rays are enabled, creeping rays are launched and traced on curved surfaces. Like SBR rays, creeping rays have footprints that cover finite areas on the curved surface. If the creeping rays are launched densely enough, they collectively cover the surface on which they propagate without overlap. The creeping-wave ray statistics provide information on the number and distribution of footprints across all creeping rays. More details can be found in Creeping Wave.
Typically, all these rays are traced successfully, and they contribute to the scattered field. If a ray encounters a critical error because of an unhandled contingency in the formulation, it gets discarded and its contribution to the scattered field is not computed. The number of these rays is given in the Num Failed.
Num Launched: Total number of creeping rays launched during simulation
Num Traced: Number of creeping rays successfully traced and radiated
Num Failed: Number of creeping rays failed and discarded without being radiated
Num Footprints (Across All Rays): Total number of footprints across all creeping rays
- Longest Ray Len (m): Length of longest creeping ray (in meters)
Shortest Ray Len (m): Length of shortest creeping ray (in meters)
Average Ray Len (m): Average length among all creeping rays (in meters)
Creeping-wave ray statistics also provide a break-down of the ray counts with respect to how the rays are terminated.
Natural Decay: Decayed normally according to Ray Decay Threshold [dB]
Curvature Not Supported: Encountered a surface where curvature could not be extracted
Non-Metallic Surface: Encountered non-metallic surface (creeping wave formulation is limited to PEC-like surfaces)
Non-Smooth Crossing: Encountered excessive slope discontinuity upon attempted crossing to next surface patch
Saddle Point: Encountered section of surface with non-negligible saddle curvature (creeping wave formulation is limited to convex surfaces)
Double-Concave Point: Encountered section of surface with non-negligible concave curvature (creeping wave formulation is limited to convex surfaces)
Unknown Creeping-Ray Error: Creeping-ray algorithm encountered an unexpected condition
Geodesic Hit an Edge: Encountered a surface edge (i.e., no continuing patch detected)
Geodesic Width Too Large: Creeping ray footprint grew too wide
Geodesic Hit an Invalid Surface: Encountered finding an incorrect neighboring surface.
Geodesic Blocked by Surface: Creeping ray is blocked by another surface
Unknown Geodesic Error: Geodesic ray-trace algorithm encountered an unexpected condition
Rough Surface: Encountered section of surface where rough surface is defined
Occasionally creeping rays cannot be launched because of problems related to the source.
Far-Field Antenna: Far-field antennas do not support CW
Antenna Too Far From Platform: The entire antenna is too far from the platform
No Ground Plane: The antenna has no ground plane
- No Closest Point: No closest point could be found on the surface
Closest Point Failure: The vector connecting the closest point to the source is not perpendicular to the surface
Current Source Too Close to Platform: The current source is too close to the platform
Current Source between Original and Fitted Surface: When an original (flat) surface was fitted with a curved surface based on its curvature information, the current source ended up between these two surfaces.
Curvature Not Supported: The closest point is on a surface that does not have curvature information
Closest Point Not Metal: The closest point is not located on a metallic surface
Closest Point On Concave Surface: The closest point is on a surface with concave curvature
Point On Saddle Surface: The closest point is on a surface with saddle curvature
Closest Point On Rough Surface: The closest point is located on a surface that has a surface roughness model defined
Similarly to SBR ray statistics, CW ray statistics include a footprint histogram,
(Num Fpt per Ray Range, Num Rays) = (39 - 51, 285)
means 285 creeping rays are terminated in a range between 39 and 51 footprint counts.