Ansys medini analyze supports qualitative attack path analysis using heatmaps. This allows you to investigate attack paths visually.
You can apply the heatmap to selected attack paths or to a complete attack tree model.
Note: Before you can use a heatmap, you must calculate the attack paths for an element. The calculation result does not have to be saved to execute the following steps.
To open the Heatmap control dialog, complete these steps:
In the Attack Path Model, select an entry and from the context menu, select Highlight Attack Path Events and Effects.
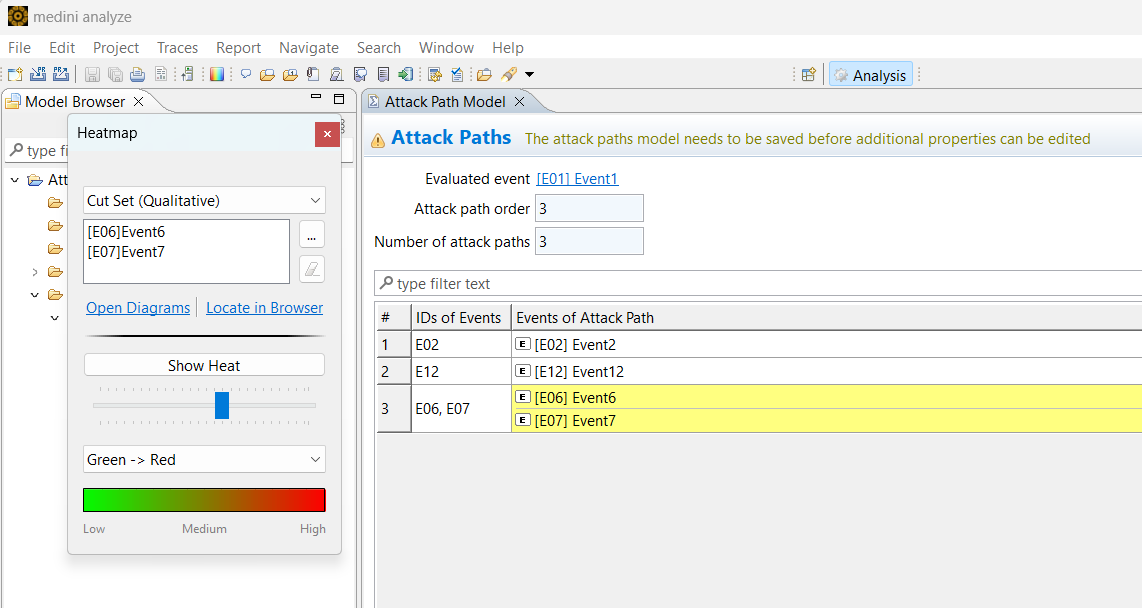
The Heatmap control dialog opens. By default it is set to qualitative cut sets, and lists the selected event(s).
Click Open Diagrams.
The tool opens all diagrams in which the events of the attack path appear.
In the Heatmap control dialog, click the Show Heat button.
The events that are part of the attack path are shown in color in all diagrams where they appear. You can use the slider bar under the Show Heat button to vary the transparency of the color.
Optionally click the ... button to select part or all of the attack path to which to apply the heatmap.
To remove the heatmap coloring, click the Show Heat button again.