


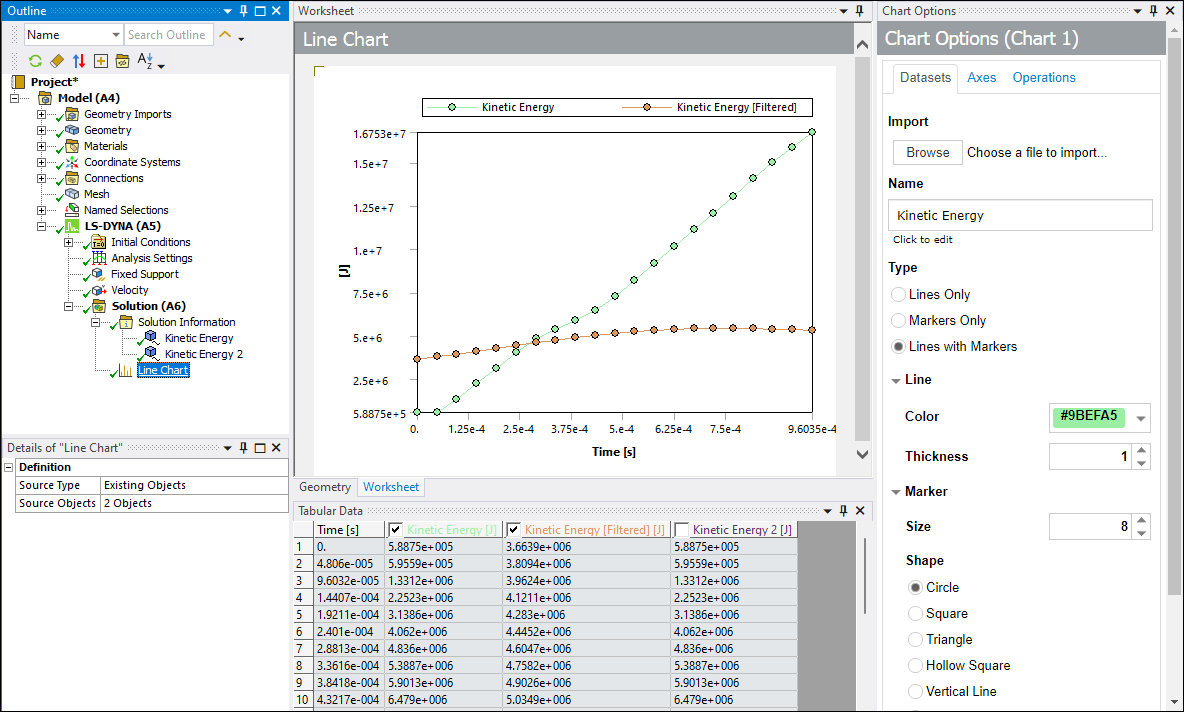
For LS-DYNA analyses, use the Line Chart object to plot a two-dimensional graph in the X and Y directions, for supported input datasets. A dataset is a specified set of two variables, X and Y Axis data, that form the 2D data for the chart.
For LS-DYNA analyses, use the Line Chart object to plot a two-dimensional graph in the X and Y directions, for supported input datasets. A dataset is a specified set of two variables, X and Y Axis data, that form the 2D data for the chart.