


The Sherlock Layer Viewer is a flexible tool that serves many purposes, including the ability to display analysis results in graphical form. While results tables provide volumes of detailed information from each analysis, the Layer Viewer's presents that information visually so it easy to see, for example, the locations of highest stress on the circuit board or which parts on the board are most susceptible to failure.
Tip: To open the Layer Viewer, right-click an analysis in the Project Tree and select View Layers in the context menu. As described in Tutorial: Layer Viewer, there are several other ways to open the Layer Viewer as well.
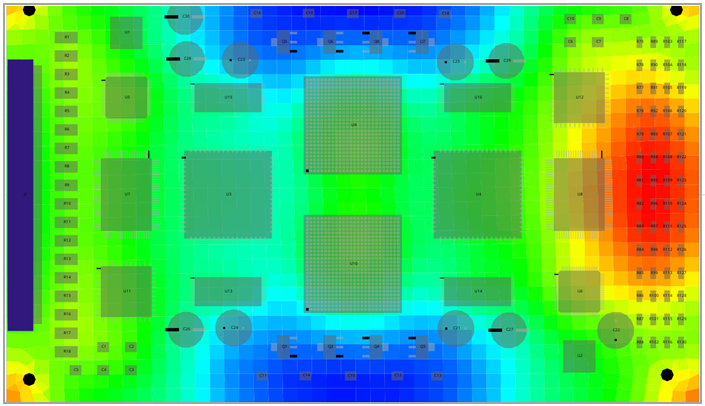
The images below demonstrate some of the Layer Viewer's capabilities.
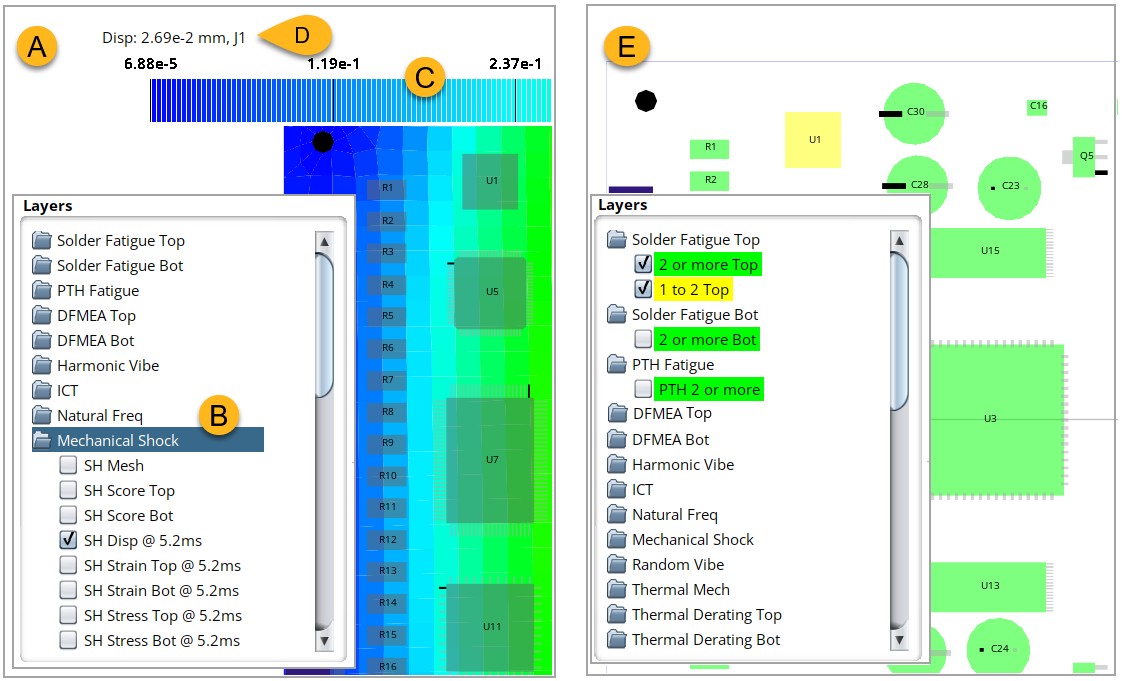
Image A shows how you can use the Layer Viewer to generate a graphical representation of board stress, strain, or displacement by selecting the relevant option in the Layer Viewer Tree (B). The available viewing options depend on the analysis type selected and how you configured the analysis. Here, the Layer Viewer displays board displacement at 5.2 ms for a Mechanical Shock analysis. A color scale (C) is provided for interpreting the display. For even more detail, hover over any element to see the numerical result displayed in the upper left (D).
The Sherlock Layer Viewer can also display part scores using the color-coded scoring system. In the example below (E), scores from a Solder Fatigue analysis are shown with most parts shaded green (Passable). Component U1 For a complete explanation of the scoring system, see Color-Coded Scoring System.
This section provides only a brief introduction to how you can use the Layer Viewer to view analysis results. For a more robust explanation, refer to the following sections:
Refer to Tutorial: Layer Viewer for a guided explanation of the Layer Viewer's features and tools. This is a good place to begin if you are new to using the Viewer.
In this user's guide, each analysis section has a subsection devoted to interpreting results in the Layer Viewer. For example, under the Harmonic Vibe analysis, refer to Harmonic Vibe Results in the Layer Viewer in the Results section to find analysis-specific information on the Layer Viewer.