


The Database Navigator displays the list of imported DFR files along with their corresponding solutions. When a result file is loaded, the tree view shows the result file name and items categorized by analysis type.
Each tree item includes buttons that allow you to open a new window or refresh the result. Additional functions shown in the figure and table below can also be configured.
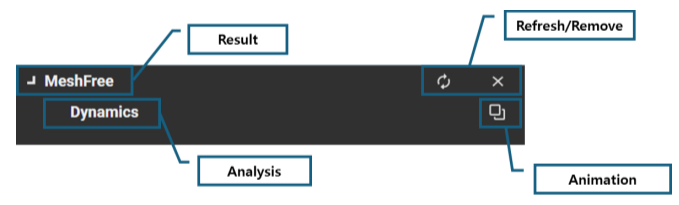
Figure 1.4: Functions in Database Navigator
When the result item is selected in the Database Navigator, its properties are shown in the Properties panel.
When , , or analysis are selected in the Database Navigator, their respective properties are displayed in the Properties panel as shown in the tables below.
Figure 1.6: Properties of a Dynamic Solution
| Category | Content | Description |
| Misc | Frame |
Controls how many animation frames are loaded for the result visualization. You can select one of the following methods:
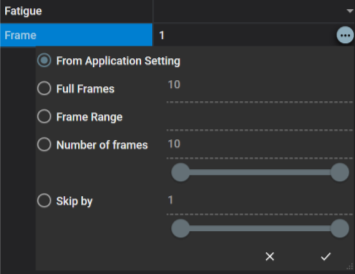
|
| Fatigue | Select the fatigue analysis result you wish to analyze. You can perform Fatigue Analysis on the selected result in the Postprocessor. Once the analysis is complete, the fatigue analysis results will be added to the list. |
Figure 1.7: Properties of an Eigenvalue Solution
| Category | Content | Description |
| Misc | Frame | Specifies the number of animation frames to load. |
| Time | Specifies the time for eigenvalue results. The mode shape and natural frequency corresponding to the defined time will be displayed in the animation view. In the Preprocessor, eigenvalue analysis can be performed at specific time points during a dynamic analysis. In the Postprocessor, you can review and analyze the eigenvalue results associated with each time point. |