


Statistics modules in Rocky collect relevant instantaneous data from the simulation during finite lapses of time, and then associate derived statistical information from that data to different entities, in order to let users visualize it in useful ways. Such statistical information, besides being usually more meaningful than simple instantaneous data, may provide a deeper insight into the dynamics of the simulated physical processes.
When the SPH Boundary Interaction Statistics module is enabled, data from all SPH-boundary interactions is collected in order to calculate statistics that will be available for visualization on the surface of walls or curves associated to them.
Note: Since Rocky allows users to choose which sub-categories of statistics will be effectively calculated, only the interaction data needed for those calculations will be collected during the simulation, in order to save memory and disk space.
The data collection units are the boundary triangles in this case. This means that a given statistical value displayed on a boundary triangle is representative of data from all interactions involving that triangle that were active during a data collection interval.
The Nodal Force property generated by the module is defined as the time average of the reaction forces acting on a surface portion around a given boundary node, when the SPH elements interact with it. All nodal forces are computed per boundary node, using the following expressions:
 | (3–58) |
Where:
 is force.
 is a boundary vertex.
 is a boundary triangle.
 is a sum involving all triangles around a vertex
  .
. is a SPH element-boundary triangle interaction.
 is a sum involving all SPH element-boundary triangle interactions
associated to a triangle T at a given time.
is a sum involving all SPH element-boundary triangle interactions
associated to a triangle T at a given time. is the time interval between two consecutive outputs.
 is a sum involving all time steps between two consecutive
outputs.
is a sum involving all time steps between two consecutive
outputs. are the Cartesian directions.
The Normal Stress and Tangential Stress are calculated as the time average of the stresses resulting from the SPH interaction with the boundary triangles. If there is no motion and the Cartesian forces are already stored, the stresses are calculated with them, otherwise, normal and tangential components of the forces are calculated and stored. The time averages of the normal and tangential stress are obtained using the following expression:
 | (3–59) |
Where:
 is the stress.
 is the area of a boundary triangle.
 are the normal and tangential directions, respectively.
The Heat Transfer Rate is calculated as the time average of the heat exchanged between the SPH elements and a boundary triangle during the time lapse between two consecutive outputs. It is computed using the expression:
 | (3–60) |
where  is the heat transfer rate and all the other symbols are the same defined
above.
is the heat transfer rate and all the other symbols are the same defined
above.
When the average heat transfer rate is positive, the net heat transfer occurs from the boundary triangle to the fluid. On the other hand, if it is negative, the heat exchange happens in the opposite direction.
The Wet Fraction associated to a boundary triangle is computed as the time average of the ratio between the approximate wet area and the triangle area. The wet fraction is computed using the expression:
 | (3–61) |
where the instantaneous wet fraction,  is computed as:
 | (3–62) |
and the wet area of a triangle,  is approximated as:
 | (3–63) |
Where:
 is SPH smoothing length.
 is initial spacing between SPH elements.
 is distance from the SPH element to the boundary triangle in an interaction
 .
.
A modified kernel function is used for approximating the wet area, based on the positions of the SPH elements interacting with the triangle at a given time. This kernel function based on the Wendland kernel and is defined as:
 | (3–64) |
Due to the use of a kernel function for approximating the wet area, SPH elements located within a distance equal to the kernel radius from a boundary triangle will contribute to that area. This means that if a moving boundary approaches a free surface, for instance, it may show wet fractions above zero before actually touching the surface.
The last parameter generated by the module is the Wet Time, which is the time that a triangle was wet during the lapse between two consecutive outputs. For a boundary triangle to be considered wet at a given time, at least one SPH element must be interacting with the triangle.
The wet time,  , is computed with the following expression:
 | (3–65) |
 | (3–66) |
Aside from the properties explained above, SPH Boundary Interaction Statistics module also generates Force, Torque and Power curves.
Each point of a Torque Curve is a time average of the torque produced by SPH elements over a wall.
Figure 3.3: Vectorial representation of the instantaneous Torque produced by an SPH element interacting with a wall.
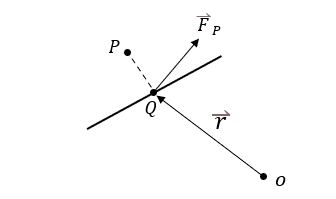
Where:
 is the position of the SPH element.
 is the orthogonal projection of onto the wall.
 is the origin of the motion frame associated to the wall.
 is the position vector of in relation to .
 is the force exerted by the SPH element onto the wall.
The instantenous torque is given by  with the position vector relative to the origin of the motion frame associated to the wall.
If there is no associated motion frame, the torque will be calculated relative to the global coordinate system's origin.
The average torque over a wall on a time interval between outputs is given by

where:
 is the simulation time step
 is the time interval between outputs
This sum includes the torques produced by all SPH elements that interacted with a wall
during .