


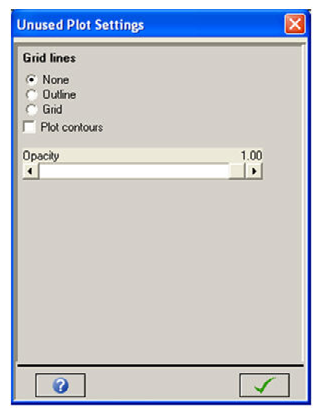
This window lets you set options for the plotting of unused regions.
- Grid lines
Select whether you want to plot the outline or grid for unused zones and whether the outline/grid is drawn in black or white.
- Plot contours
Check this box if you want the contour variable contoured on unused faces (for contour plots). Otherwise the face is displayed in grey.
- Opacity
Set the opacity for unused regions. An opacity of 1.0 means you cannot see inside the region. An opacity of 0.0 is equivalent to turning hidden line removal off (that is, you can see everything inside the region).