Numerical data can be imported using the Import Numeric Data interface.
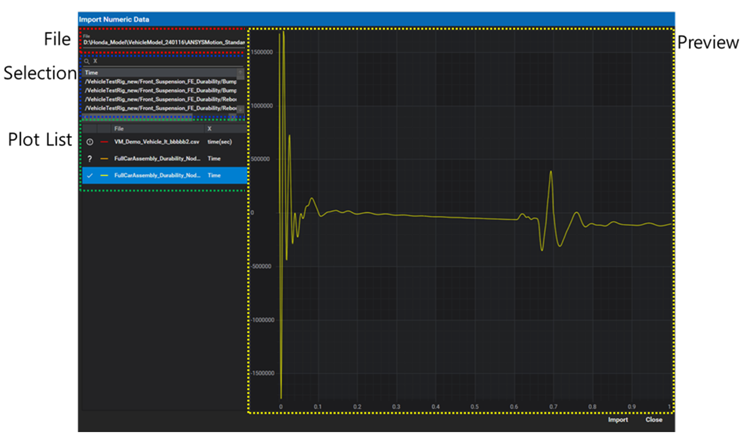
Figure 2.5: Parameters for numeric data import
| Area | Content | Description |
| File | File | Used to set selected File name. |
|
Used to browse and import the file. Supported file extensions are CSV (*.csv), Text (*.txt), Solver output file (*.out), and RPC III (*.rsp) Data in a CSV file should be comma-separated. Data in a TXT file should be tab-separated. RPC-III is a common, binary time-history format. The signals stored in this format are written in blocks of given size. Supported FILE and TIME TYPE for a RPC-III file are restrictied to Time history and RESPONSE. | ||
| Selection | X, Y |
Used to select the X and Y header names for plots from the numerical data. X and Y header values can be filtered by name using the
|
| Name | Used to define the plot legend name. | |
Used to add selected data (X, Y, Name)
to the plot list. | ||
| Plot List | Status for preview |
|
| File | Selected file path for plot or preview. (Read only) | |
| X, Y | Selected X, Y header name for selected file. (Read only) | |
| Name | Legend name for the plot. | |
| Used to delete plot data. | ||
| Preview | Preview Area | Area to preview the selected plots. The data to preview should be loaded (check the status icon, as above). Multiple plots can be previewed at once. |
| Import | Use to draw the plot list in the activated (selected) Chart View. All currently-unloaded plots from the list will be drawn. If there is no activated (selected) chart view, a new chart view will be created. | |
| Close | Use to cancel and close the numeric data import process. |
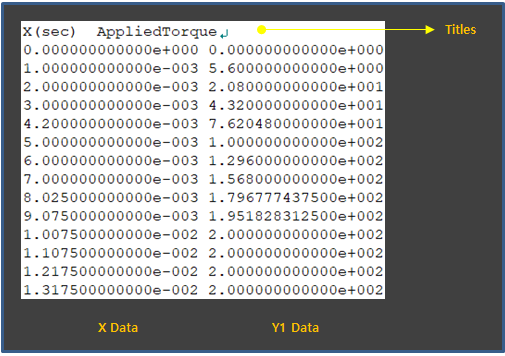
TXT and CSV files are only supported if they comply with separation rules as shown in the figure below. The first column is the title and data for the x-axis and second column is the title and data for the y-axis. If data is added, its title and data must be written in the next column.