Only curves plotted in the time domain are available for analysis in Ansys Sound: Analysis and Specification, but multiple curves can be exported at once. Data is interpolated, if necessary, to ensure the same time-step.
To launch the Ansys Sound: Analysis and Specification interface from the Motion Postprocessor:
Select the required curve in Chart view.
Click on the Analysis ribbon menu.
This launches the Ansys Sound: Analysis and Specification application.
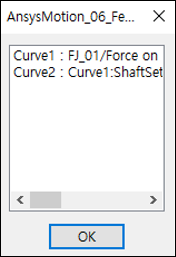
Select the required signal from the Ansys Sound: Analysis and Specification dialog (see below).
Click .
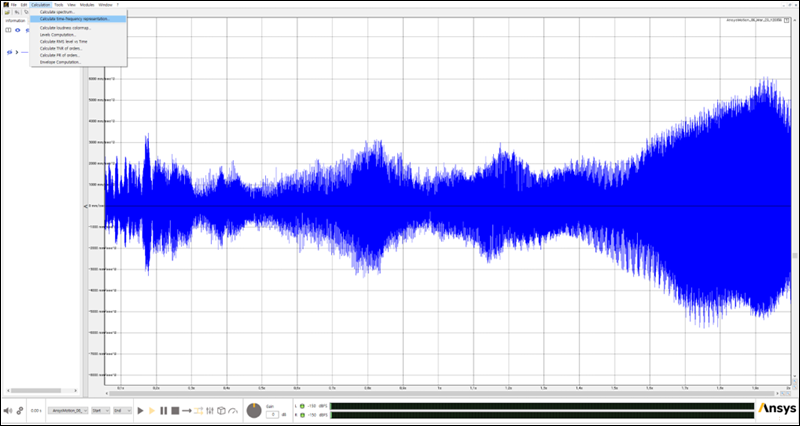
In Ansys Sound: Analysis and Specification click > (see below).
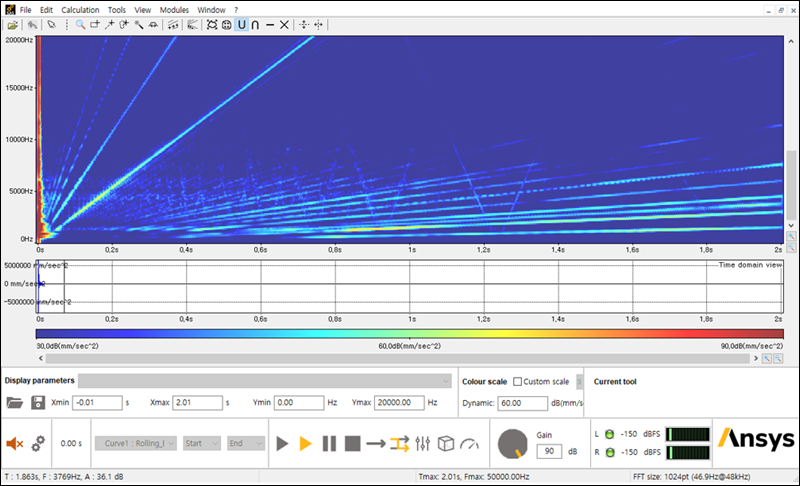
Confirm the parameters in the Time-frequency representation calculation dialog and click .
The time-frequency representation is displayed. See Order Analysis in the Ansys Sound: Analysis and Specification User's Guide for more information.