Once the Harmonic Response system is solved, insert the Mode Multiplier result.
This will display the content of the matrix fileaVec.matr file in tabular data and graph format.
- Mode Multiplier Settings
Results Part: Choose between the display of , or . Amplitude= √(Real2 + Imaginary2)
Frequency: Choose the Harmonic Response system frequency to evaluate from the drop-down list.
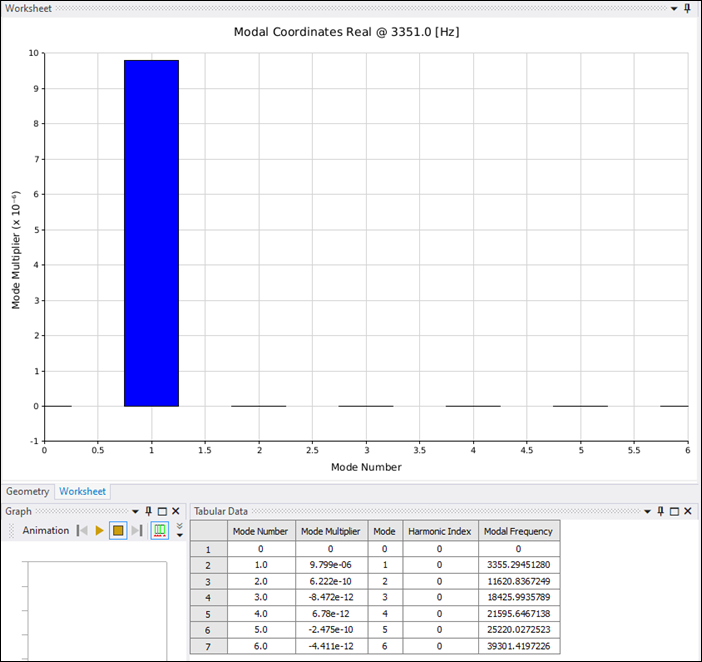
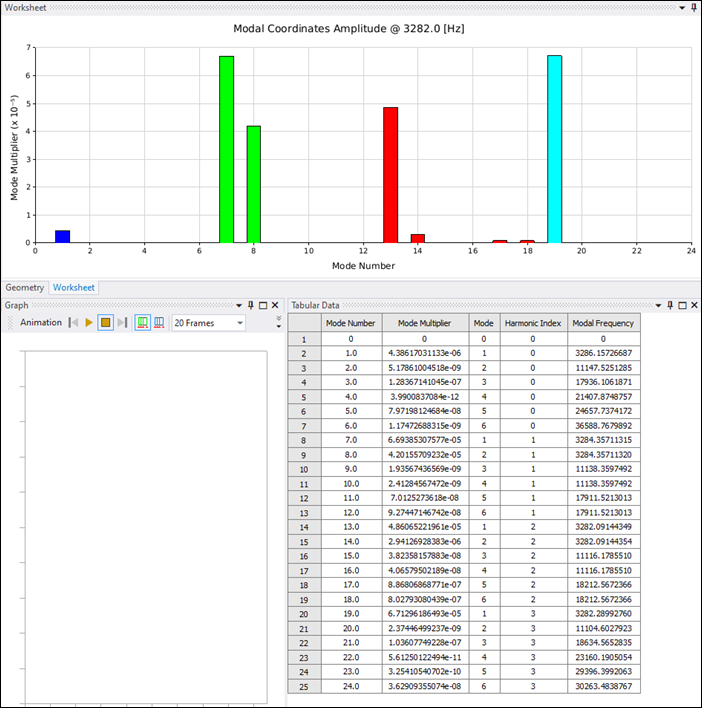
For Analysis, the first 2 columns of the tabular data display the information extracted from the fileaVec.matr file with the Mode Multiplier values. The next columns then correlate the mode multiplier value to the corresponding mode, harmonic index and frequency of the Modal system.
The graph displays the Mode Multiplier selected Results Part (Amplitude, Real or Imaginary) for the modes and Harmonic Indexes. Note that each of the Harmonic Index (HI) bars are plotted with the same color. If HI is higher than 8, the colors will repeat in the same order.
For Analysis, the first 2 columns of the tabular data display the information extracted from the fileaVec.matr file with the Mode Multiplier values. The next columns then correlate the mode multiplier value to the corresponding mode, harmonic index and frequency of the Modal system. Note that only the Harmonic Index selected as Cyclic Controls > Engine Order of Excitation is displayed.
The graph displays the Mode Multiplier selected Results Part (Amplitude, Real or Imaginary) for the modes and single Harmonic Index selected.