


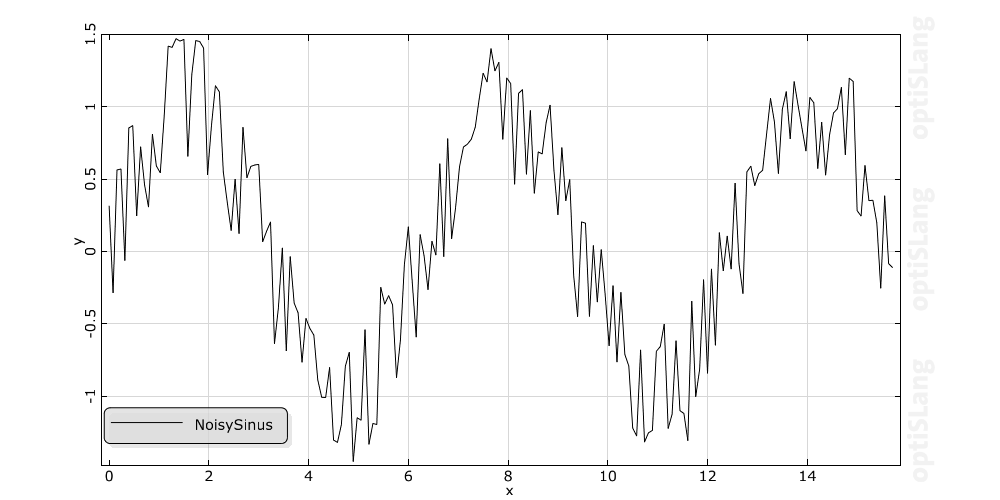
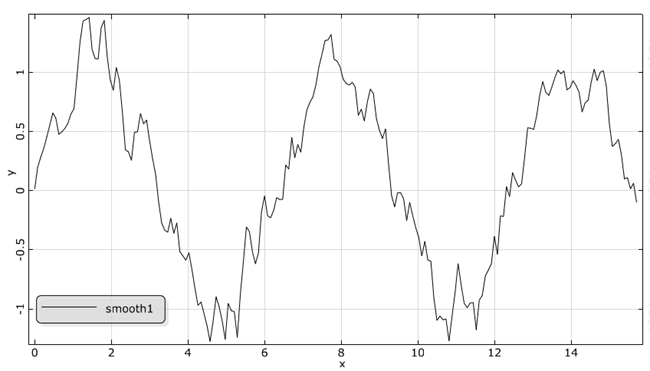
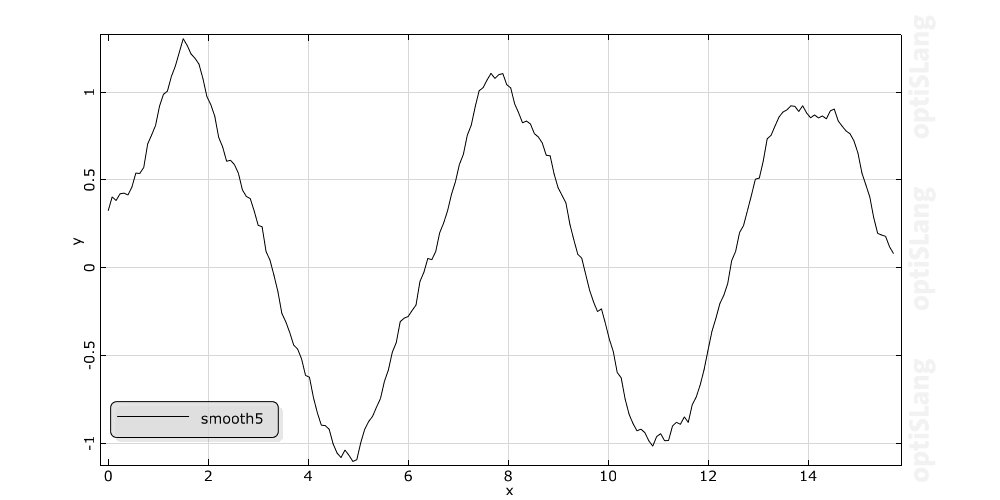
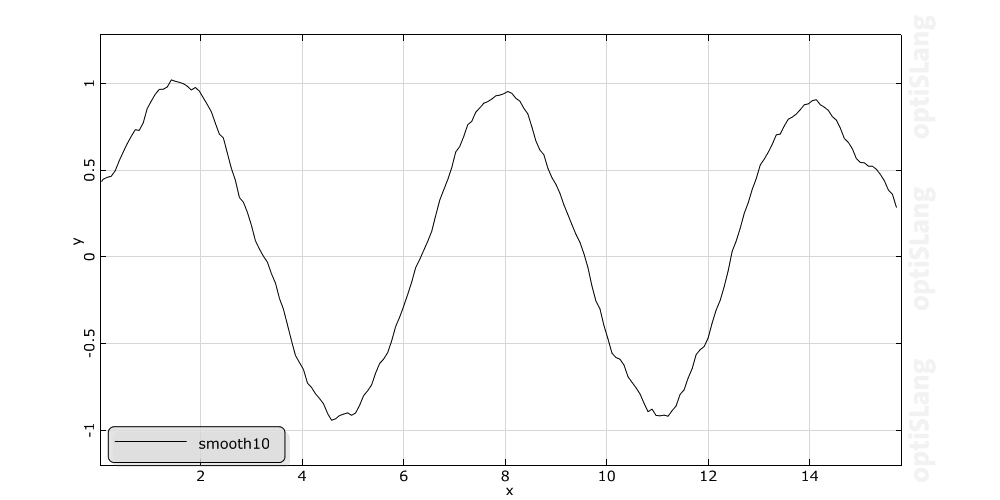
Smoothes the curve through the sample points of the real time signal S by using the moving average method. The new signal has the same time values as the original data. At each time the new value is calculated as the average of 2n+1 neighbouring values of the original data. This means the specified value n is interpreted as the number of points to use on either side of the current data point. For example let n be 2, so the smoothing function uses 5 values to compute each new data point. The larger the value n, the smoother is the output.
Example with different numbers of points n:


Syntax
smoothFilter(S, n)
Types
| Variable Name | Value Type | Variable Type | ||
|---|---|---|---|---|
| Arguments: | S | real | signal, xy-data | |
| n | real | scalar | ||
| Result: | real | signal, xydata | ||
Calculator Input
Use the button to complete the operation.