


The FRF Mode Contribution displays the mode contribution of each mode to the selected FRF in the FRF Worksheet.
The FRF Mode Contribution is divided into three parts:
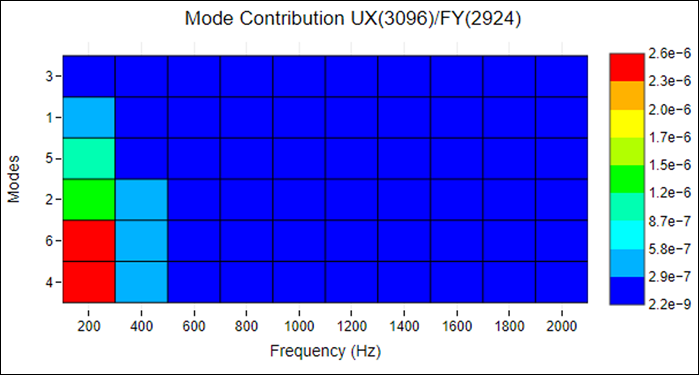
- Mode Contribution Table Plot
A dynamic plot that allows hovering, zooming and panning operations. The number of modes displayed, the frequency range and legend can be manipulated using the Chart Options in the Details panel. The data will always be sorted from minimum to maximum, based on the number of modes and the frequency range selected.
Clicking the icon (reset axes) replots the data in the user-defined frequency range.
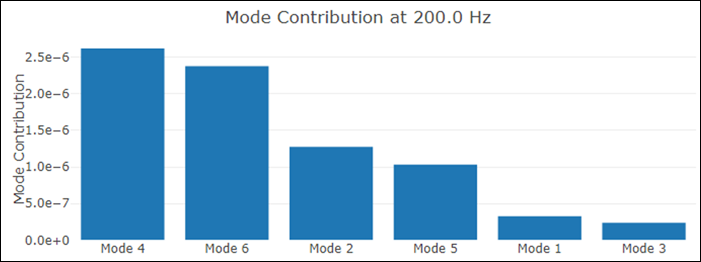
- Mode Contribution Bar Chart
A dynamic plot that allows hovering, zooming and panning operations. This data displays the mode contribution information for the frequency specified using the Chart Options in the Details panel. The number of modes is also controlled by the Chart Options. The data will be sorted in the same way as displayed in the Table Plot (it is not sorted for this specific frequency).
Clicking the icon (reset axes) replots the data in the user-defined frequency range.
- Chart Options
The following properties are available:
Modes To Display
Allows you to change the number of modes displayed in both plots.
Legend Minimum
Allows you to select the minimum value of the legend in the Table Plot. It cannot be lower than the minimum available value available. If the table plot changes size (number of modes by frequency range) and the legend minimum value is lower than the minimum, it will be updated to this new value.
Legend Maximum
Allows you to select the maximum value of the legend in the Table Plot. It cannot be higher than the maximum available value. If the table plot changes size (number of modes by frequency range) and the legend maximum value is higher than the maximum, it will be updated to this new value.
Frequency Minimum
Allows you to select the minimum value of the frequency range. It cannot be lower than the available data.
Frequency Maximum
Allows you to select the maximum value of the frequency range. It cannot be higher than the available data.
Frequency
Allows you to select the frequency value in the Bar Chart. It cannot be lower than the Frequency Minimum value or higher than the Frequency Maximum value.
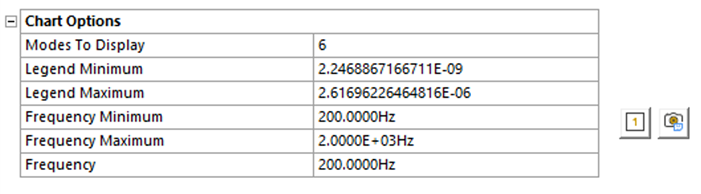
You can also show or hide mode contribution values from the Table Plot using the first button or export an image using the second.