


The thinning diagram can display total thinning, current operation thinning, or thickness during each operation of the forming process. Choose from the Analysis Ribbon Elements to display the Thinning task panel and display a plot of material thinning in the Graphics Window.
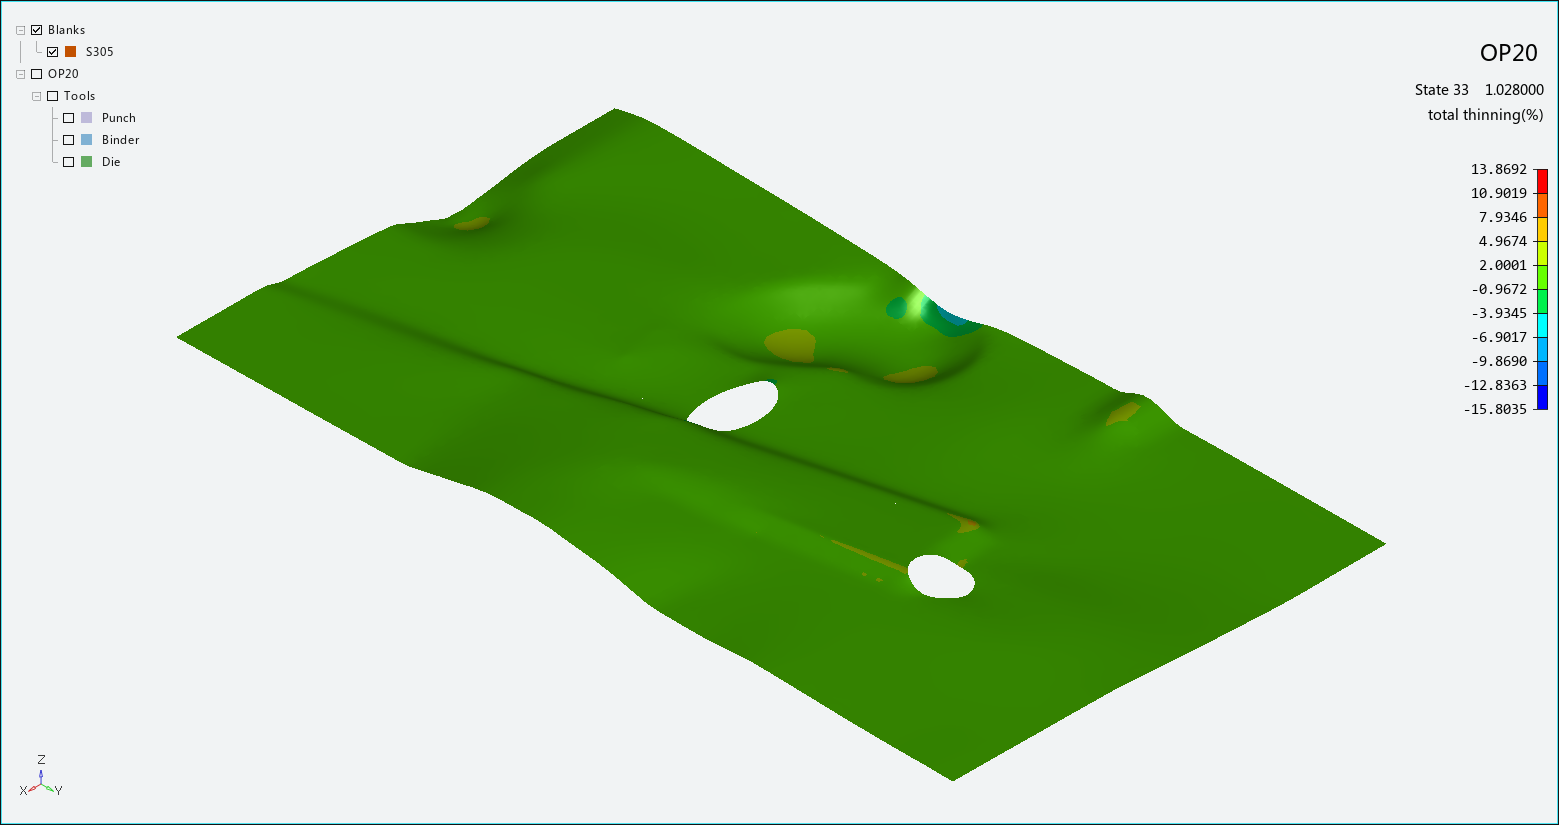
Use the Thinning task panel to select individual operations to view, or to play an animation of the forming process. A legend along the right edge of the Graphics Window displays the thinning value of each color used in the plot.
Select a Component from the list to display that component's values on the plot. Available components are:
Total thinning (as a percentage)
Current operation thinning (as a percentage)
Thickness
Select the Smooth Results check box to apply a smoothing function that yields a more attractive plot. Clear the check box to display a more accurate plot.
Click to use the List Value Task Panel to pick points to display the numerical thinning values at those points on the plot.
Click to use the Contour Setting Task Panel to modify the settings of the thinning plot.
When you are finished with the thinning plot, click the button to return to Viewing Basic Deformation Results.