


Transient postprocessing in Fluent allows you to analyze results after Fluent is done running. You can investigate values of monitors that were not captured during the run and create animations of the solution evolution. Additionally, you can compare contours from different time steps and generate a difference plot.
Transient postprocessing gives you the flexibility to capture data that was not gathered when the data files were originally generated. For example, you forgot to define a monitor or create an animation definition prior to running the solver.
Accessing the Feature:
Enable Transient Postprocessing in the Transient Postprocessing ribbon tab. The case must be defined as transient to have the Transient Postprocessing tab available (Transient must be selected in the General task page - Time group box).
Important: Transient postprocessing is not for looking at individual results. If that is your intent, load the data file of the desired time step last, and it will be available for postprocessing.
The features of Transient Postprocessing are described below.
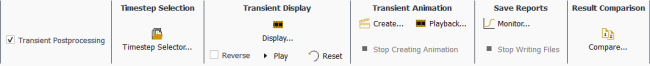
Controls
- Timestep Selector
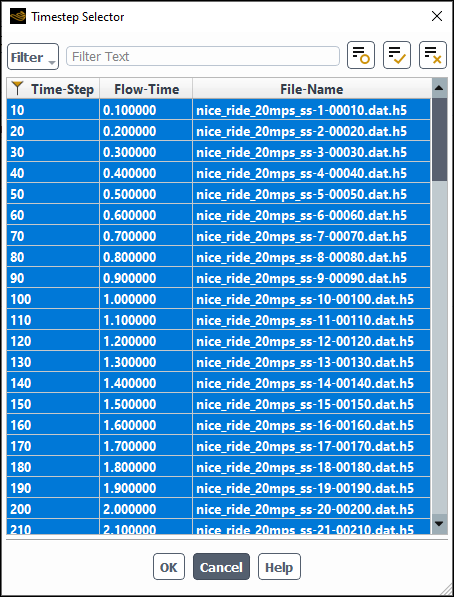
Controls which data are included for the creation of the transit postprocessing operations –report plots and animations. It is not for selecting an individual timestep to interrogate. Regardless of which timestep(s) is selected in the Timestep Selector, when you evaluate an individual post object (report, contour, and so on) the values shown are for the final timestep.
- Transient Display
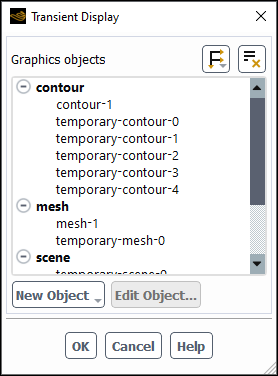
Creates the equivalent to an animation that is not stored. It shows the progression of the selected item as the data (specified in the Timestep Selector) is read and the plot object displayed.
The playback of the transient display is controlled via the Reverse check box, Play/Pause, and Reset buttons.
Important: If you want to save animations or plot data for future re-use, you must use the Animation… and Monitor… functions in the ribbon.
- Animation...
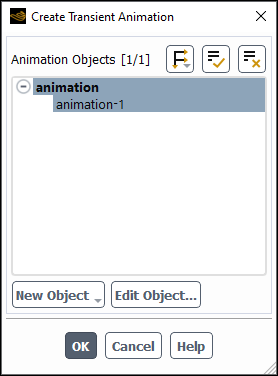
Allows you to create animations of contours, vectors, scenes, and plots, based on the data selected in the Timestep Selector.
- Monitor...
Allows you to create report files based on the data selected in the Timestep Selector.
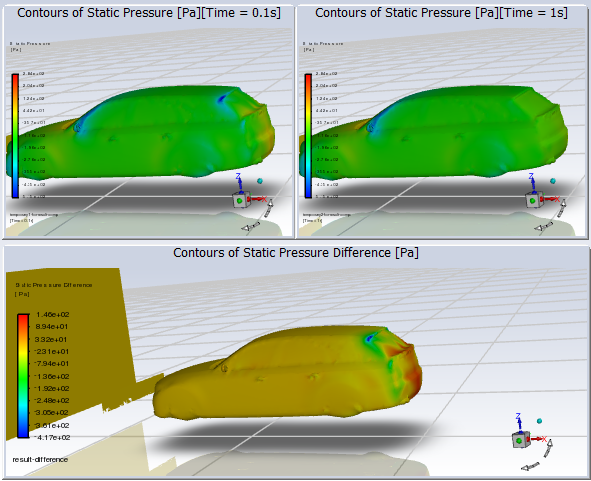
- Compare Results...
Allows you to select 2 timesteps and compare the contour plots. This shows the 2 contour plots side by side along with a plot showing the differences.
Specify which data you want included in the animation using the Timestep Selector.
Create the type of postprocessing object that you want animated. Report Definition (and requisite Report File and Report Plot), Contour, Vector, Scene, XY Plot are supported.
Create an animation definition for each object you want animated.
(Optional) Adjust the range of the graphics object included in the animation definition to reflect the minimum and maximum across the entire dataset by entering the
transient-post-processing/compute-and-clip-rangetext command. This ensures the colormap is sized consistently for the entire animation.Click Animation… in the ribbon, select the desired Animation Objects, and click .
Create a report definition (and corresponding Report File and Report Plot) for each desired quantity. Refer to Monitoring and Reporting Solution Data in the Fluent User's Guide for additional information on report definitions.
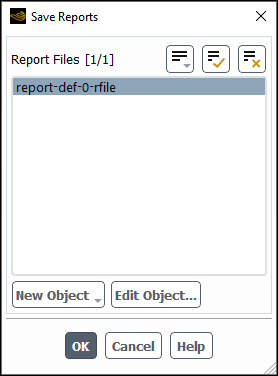
Click , select the report files you want written, and click .
Note: you can click to stop Fluent from writing more files.
Create a contour plot for the quantity and surfaces you want to compare.
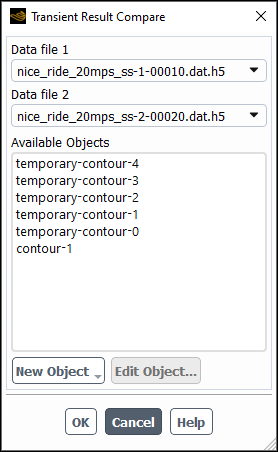
Click , select the first and second data files and the contour plot, and click .
Important: Only one result comparison is available at a time. That is, even though a
result-comparison contour plot is created that appears
under Contours in the Outline View tree, if you perform
another result comparison, the definition of the comparison plot will change
accordingly. This change occurs even if the
result-comparison contour object is copied and
renamed.
The following limitations are present for transient postprocessing:
Transient postprocessing is not supported when running Fluent in Workbench.
While using transient postprocessing functionality you cannot initialize or solve.
Do not save case or data files while performing transient postprocessing as it may inadvertently affect the state of the solution.
Only volume and surface type report definitions are supported.
Only the following variables are supported:
Material properties: density, molecular viscosity, volume fraction, normalized volume fraction
Pressure: static pressure, dynamic pressure, pressure coefficient, absolute pressure, total pressure
Velocity: velocity magnitude, X/Y/Z velocity, axial velocity, radial velocity, tangential velocity, relative velocity magnitude, relative X velocity, relative Y velocity, relative Z velocity, relative tangential velocity, velocity angle, relative velocity angle, cell reynolds number
Temperature: static temperature, enthalpy, total enthalpy, total enthalpy deviation, total energy, rothalpy, internal energy, total temperature
Turbulence: turbulent kinetic energy (k), turbulent dissipation rate (Epsilon), specific dissipation rate (omega), y-plus, y-star, turbulent intensity, laminar kinetic energy, turbulent viscosity, effective viscosity, turbulent viscosity ratio, and turbulent reynolds number
Species: mass fraction, mole fraction, surface deposition, and surface coverage of species
Wall Fluxes: skin friction coefficient, wall shear stress, x-wall shear stress, y-wall shear stress, z-wall shear stress, total surface heat flux, radiation heat flux, solar heat flux, surface heat transfer coefficient, wall adjacent heat transfer coefficient, surface nusselt number, surface stanton number
Mesh: x-coordinate, y-coordinate, z-coordinate, axial coordinate, angular coordinate, absolute angular coordinate, radial coordinate