Fluent and EnSight use slightly different terminology, that can trip you. In this case, Contours is to be considered a false friend word.
In order to see the distribution of a variable on a 2D part, in Fluent you create a Contour. This is a new part, and is always shown with the distribution of the variable that has been used for its creation.
In EnSight, if you want to see the distribution of a variable on a part, you can change the "color" attributes of the part itself to be colored by that variable. This operation will not create a new part, since the "color by" is considered an attribute of the existing part and not a new part all together. You can change the variable you're using to color by any time.
EnSight also contains a Contour feature. This is not the same as the Fluent Contour. When you create a Contour in EnSight, this creates a new part that consists on the iso-bar of the variable: 1D lines that show where the variable has a set value.
Example 1.1: Contour Feature
Launch EnSight and, from the Welcome window, select the AMI Dataset example session. Select part 1 in the part list, right-click on it and select → . This will create a new part with ID = 3, called Clip_plane. This is a slice in the X direction of the 3D domain.
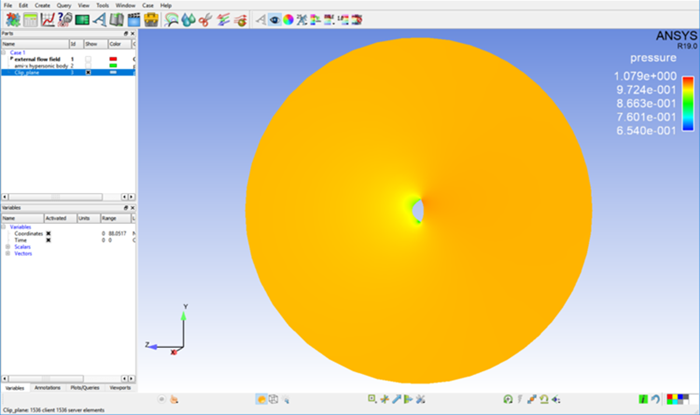
Now, select this new part in the part list, right-click and select → . In the pop up menu that appears, select the variable pressure (under Scalars). You will see that now the part shows the distribution of this variable, but no new parts are created in the part list.
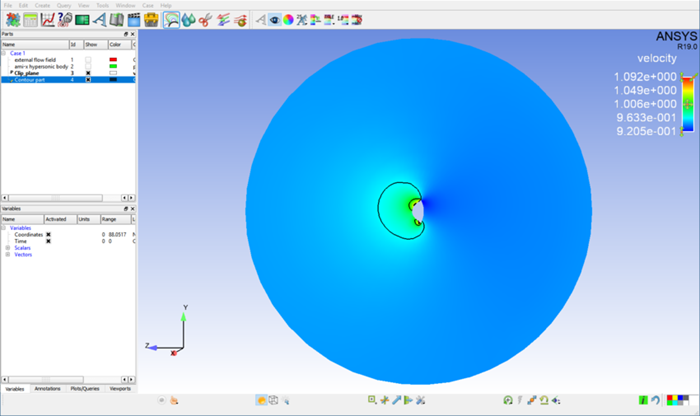
You can right-click again on part 3 and set it this time to be colored by the vector variable velocity.
Note: Notice how, also this time, a new part was not created. This is because the color-by is considered an attribute to a part, not a new part.
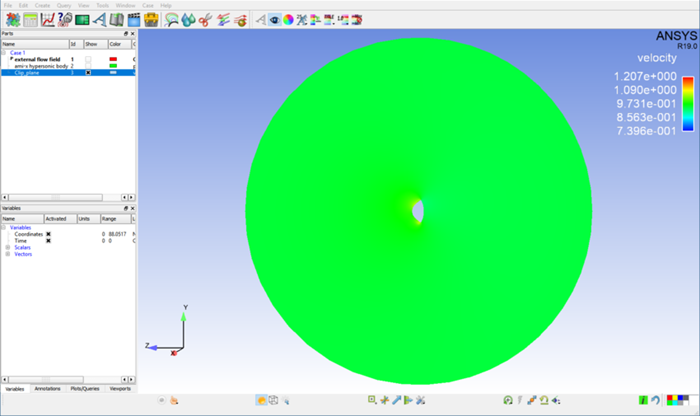
The min. and max. of the velocity palette are automatically set to the min. and max. of the variable at the current timestep on the entire model. Right-click on the velocity legend in the Viewport → → . This will change the min. and max. values to create a better visualization.
Finally, we can create a Contour part and see what this is in EnSight. Right-click on the Clip_plane part in the part list and select → . In the editor that opens, set as the Variable velocity, and hit the button at the bottom of the widget.
Note: A new part will appear on the part list: the Contour part.
Right-click on the Contour part and select → . Some black lines will appear on the clip. These lines represent the path along which the velocity has a constant value. If you hide the Clip_plane part (right-click on it and select ), you can see that the Contour part is only these lines.