
- Mechanical APDL Function
Displays animated graphics data for nonlinear problems.
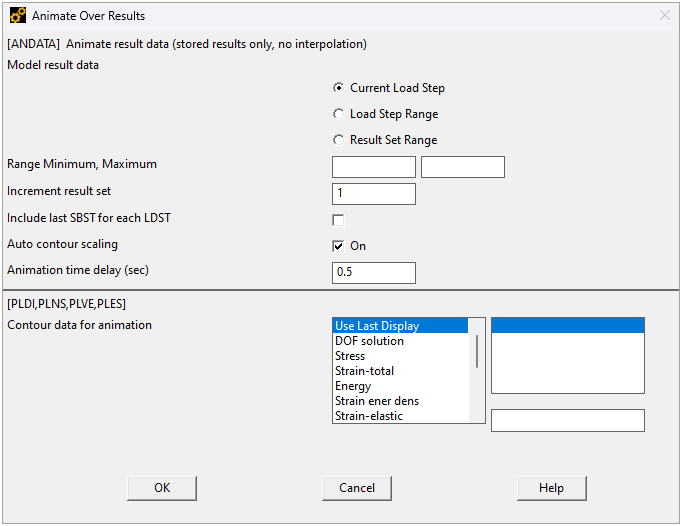
- Model result data
Chooses the results data type to be used for the animation sequence.
Current Load Step
Load Step Range
Result Set Range
- Range Minimum, Maximum
The minimum and maximum values of the range. If either value is left blank or 0, the respective value defaults to the first/last data point.
- Increment result set
Value to define the increment between the result data.
- Include last SBST for each LDST
If enabled, adds the last substep for each loadstep when displaying the graphics data.
- Auto contour scaling
If enabled, automatically scales the contour values based on the overall subset range of values.
- Animation time delay (sec)
Value representing the time delay during the animation.
- Contour data for animation
Select Use Last Display to view the previous animation, or select one of the other options to animate new contour data. For more information on the other options, see the following commands' documentation: PLDISP, PLNSOL, PLVECT, and PLESOL.