


You can use this command to access options for showing or hiding a few objects in the graphics view:
Graphics.ViewOptions
Supported graphical view properties are listed below.
| Property | Description |
|---|---|
ShowLegend | Gets or sets whether a legend is shown for the result object. |
ShowTriad | Gets or sets whether the triad is shown. |
ShowRuler | Gets or sets whether the ruler is shown. |
Reset | Resets the graphics view properties to the defaults. |
ShowMesh | Gets or sets whether to display the model’s mesh. |
ShowRandomColors | Gets or sets whether to show random colors for each object of the application. |
ShowVertices | Gets or sets whether to display all the vertices of the model. |
ShowClusteredVertices | Gets or sets whether to display all closely clustered vertices of the model. |
ShowEdgeDirection | Gets or sets whether to display the edge direction arrow. |
ShowMeshConnection | Gets or sets whether to display edge connection using a color scheme based on the mesh connection information. |
ShowThickEdgeScoping | Gets or sets whether to thicken the display of edge scoping. |
ModelDisplay | Gets or sets the model display options. |
ModelColoring | Gets or sets the model display coloring options. |
RescaleAnnotations | Rescales the size of annotations following a zoom in or zoom out of the model. |
ShowCoordinateSystems | Gets or sets whether to display all defined coordinate systems. |
ClusteredVertexTolerance | Gets or set the clustered vertices tolerance value. |
ShowBeamThickness | Gets or sets whether to display the thickness of beams. |
ShowShellThickness | Gets or sets whether to display the thickness of shells. |
ShowSPHExpansion | Gets or sets whether to display the expansion for sph elements. |
ShowRemotePointConnections | Gets or sets whether to display the Remote Point Connections. |
Code Examples
This code hides the ruler and the triad and shows the legend for the active result:
Graphics.ViewOptions.ShowRuler = False
Graphics.ViewOptions.ShowLegend = True
Graphics.ViewOptions.ShowTriad = False
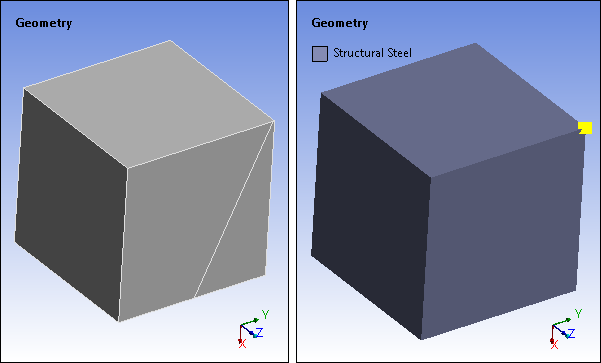
This code modifies the global view options settings by rescaling the annotations, setting the model display by shaded exterior, model coloring by material, setting the clustered vertex tolerance to 0.5 and displaying the clustered vertices:
Graphics.ViewOptions.RescaleAnnotations()
Graphics.ViewOptions.ModelDisplay = ModelDisplay.ShadedExterior
Graphics.ViewOptions.ModelColoring = ModelColoring.ByMaterial
Graphics.ViewOptions.ClusteredVertexTolerance = Quantity( 0.5, 'm')
Graphics.ViewOptions.ShowClusteredVertices = True
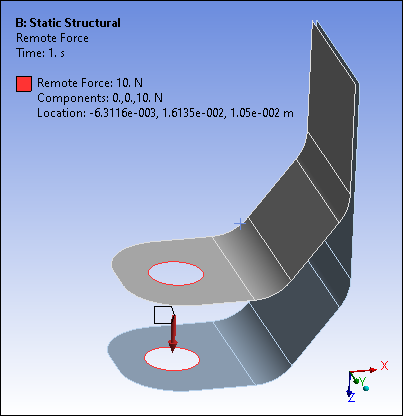
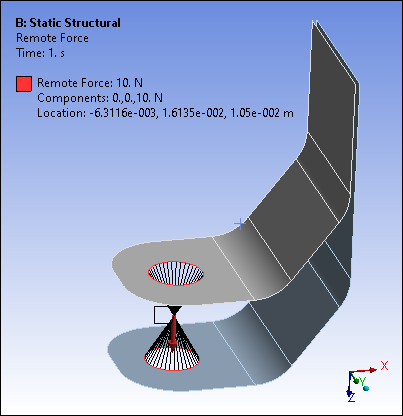
This code displays connection lines between geometry and Remote Points or between supported remote boundary conditions and Remote Points.
Graphics.ViewOptions.ShowRemotePointConnections = True
|
|
|
For information about legend settings for Mechanical results, see Working with Legends.