For a thick solid composite model, the 3D failure analysis shows a more accurate stress state of the structure than a 2D analysis. In this section, you will create and compare the 3D and the 2D Puck failure results on the model.
Evaluating 3D and 2D Puck Failure Criteria
In this section, you will evaluate both 3D and 2D Puck Failure criteria. It is good practice to use multiple failure criteria for your results since some are only applied to certain materials (see Failure Criteria vs. Ply Type Table in the Composites Theory Reference).
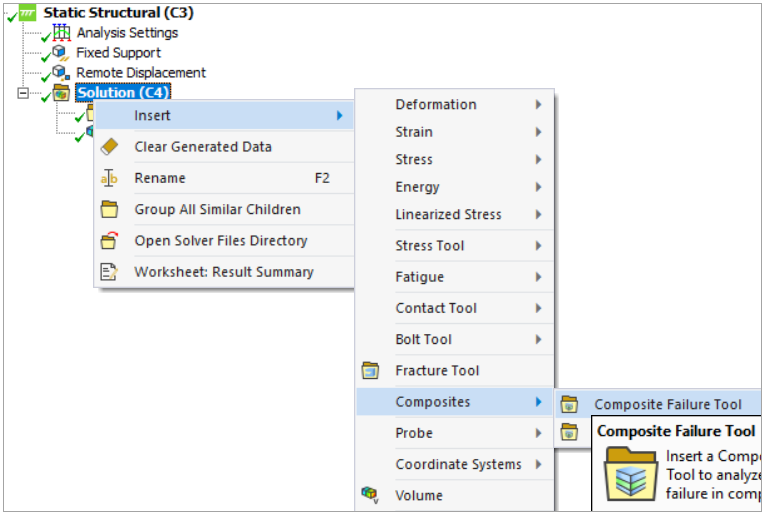
Right-click the Solution group and select Composites > Composite Failure Tool.
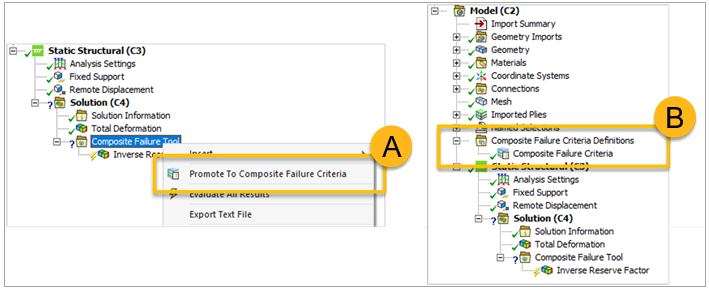
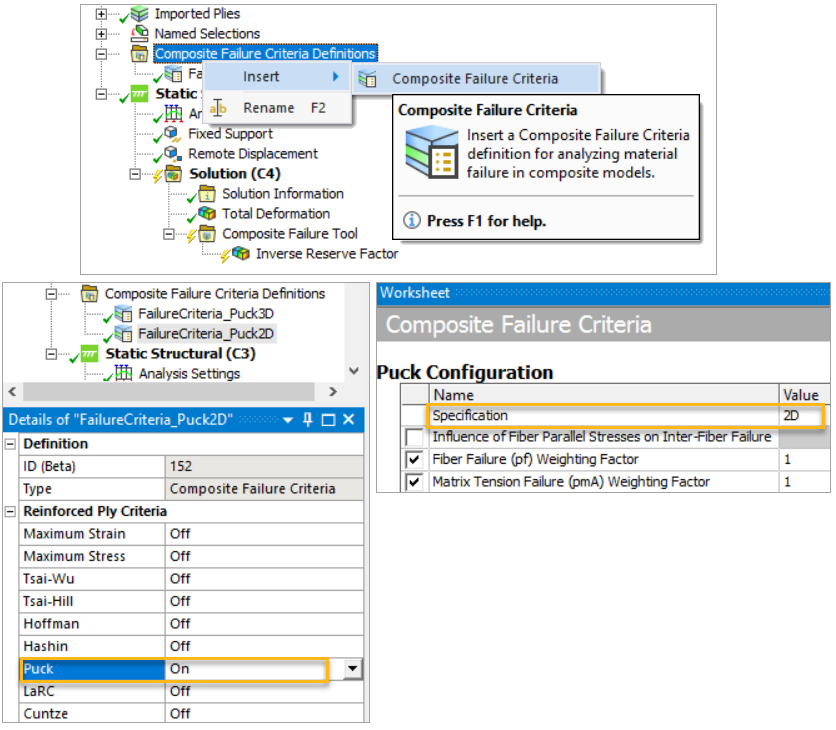
Right-click the newly created Composite Failure Tool group and Promote to Composite Failure Criteria (A in the figure below). This will create a Composite Failure Criteria Definitions group in the Mechanical application's Tree View (B).
Rename the Failure Criteria Definition object to
FailureCriteria_Puck3D. Then, in its Details panel, set Puck to On.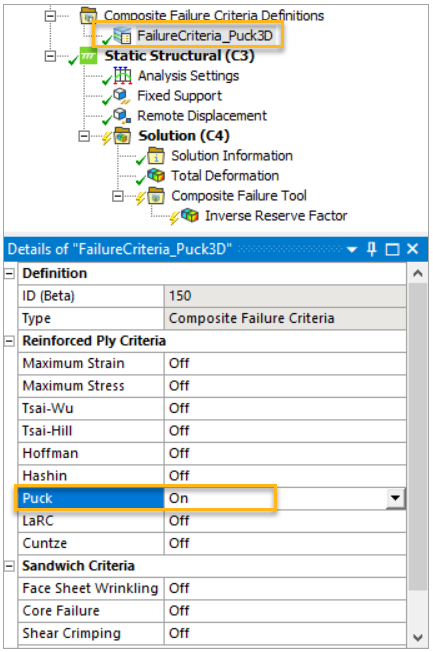
Note: For more information about Puck failure criteria, see Puck Failure Criteria in the Composites Theory Reference.
In the Puck Configuration dialog of the Composite Failure Criteria worksheet, set the Specification to 3D.

Right-click the Composite Failure Criteria Definitions group and insert another Composite Failure Criteria object. Define the Puck 2D Failure Criteria using the same process from steps 3 and 4, and set the Specification to 2D as shown in the figure below.
Note: You can apply any Reinforced Ply Criteria shown above in 3D analysis and evaluate them at the same time.
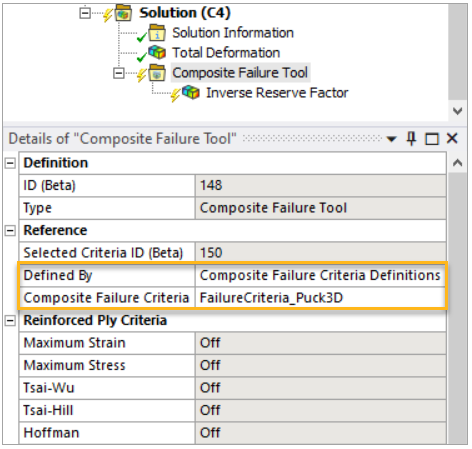
The Composite Failure Tool group that was originally created is now defined by the Puck 3D Failure Criteria after the “Promote to” operation in step 2.
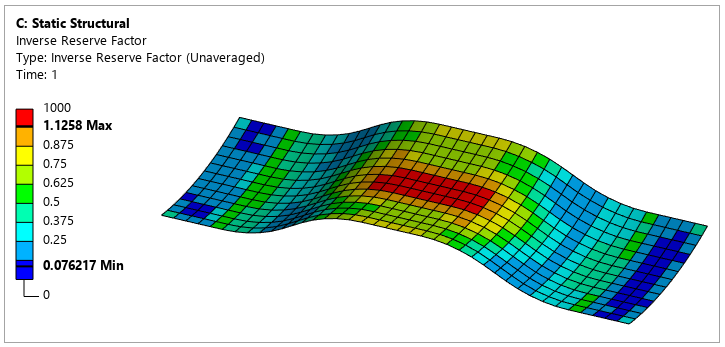
In the Tree View, under the Composite Failure Tool, select the default Inverse Reserve Factor result object. In its Details panel, set Show on Reference Surface to Yes.
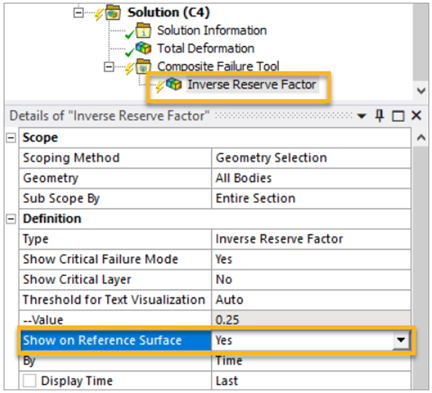
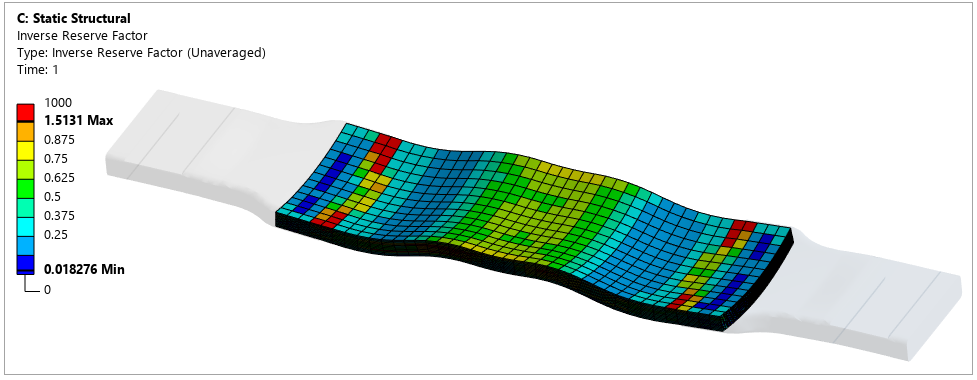
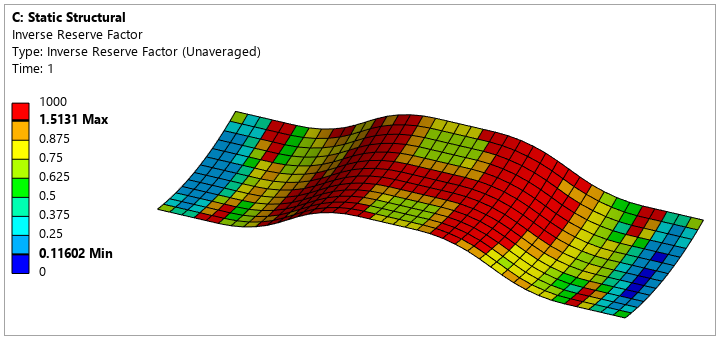
Right-click the Inverse Reserve Factor result object and select Evaluate all . The 3D failure plot is now visible in your model:
Define the 2D failure plot by inserting a new Composite Failure Tool under the Solution and following steps 6 to 8 above.

Evaluate the Inverse Reserve Factor result object under the newly created Composite Failure Tool group. The 2D failure plot is shown in your model. Compare this with the 3D plot above to see the differences.
Note:The Show on Reference Surface feature enables you to postprocess the solid model as you would with the surface equivalent. Specifically, it projects the worst-case result from all solid layers to the reference (surface) geometry.
You can also postprocess the structure by visualizing the results on the solid geometry. To do this, disable the Show on Reference Surface and evaluate the result.