This topic describes the output data of a thermal camera sensor.
Thermal cameras are well suited for detection in low-dimmed or hazy environments and
particularly suited for pedestrian detection. This sensor produces reliable images depicting the
spatial distribution of heat in shades of grey and can also produce associated temperature maps
providing the temperature in kelvins for each pixel of a produced image.
files saved to the disk when the Camera Recording format is set to
PNG.
Note: The only valid Camera Recording Format for a thermal
camera is PNG. If the camera recording format is not set, or if
another recording format type is set, no output will be saved to disk.
Output Types
The thermal camera outputs one or two types of results depending on how you set the simulation parameters:
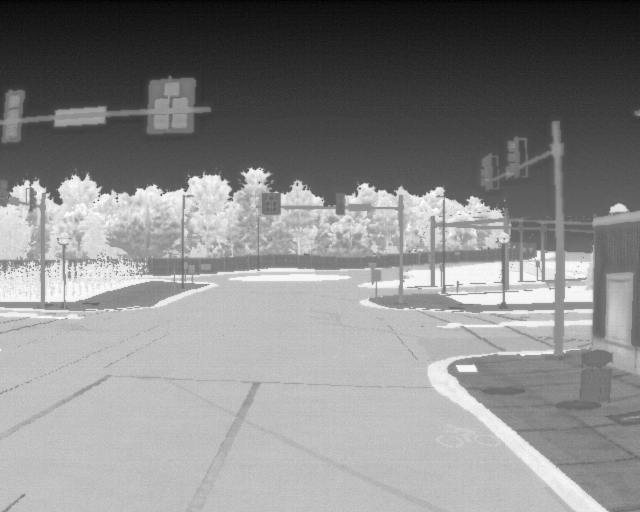
Grayscale image
Note: The image type produced depends on what was defined in
the simulation parameters.
Similarly to a camera simulation, the thermal camera
outputs a .png image per simulation time step. However, the .png is rendered in
grayscale.
The grayscale image is an image where the only colors are shades of
grey. They are particularly used in the depiction of heat maps.
In such images,
each pixel (encoded within the 0-255 range) is only meant to illustrate the temperature
relationship between the objects of a given scene. Hence, the grey color scale must not
be interpreted as an absolute indicator of the temperature but as a relative temperature
indicator.
Figure 1. Example of PNG file
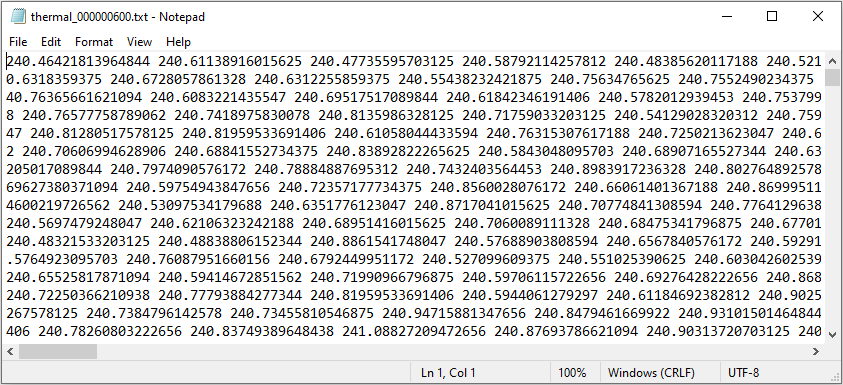
Temperature Map (particularly useful in a debugging context)
Text (*.txt)
file providing the temperature of each pixel of the rendered image in kelvins.
The values are organized as a table to effectively represent the generated
image:
the number of lines = the image's resolution height
the number of values per line = the image's resolution width
Figure 2. Example of Temperature Map
Tip: You can convert the temperature map output into an xmp file using
the Virtual Photometric Lab.
The character used as decimal separator must be a dot ('.') not a comma (','), if
needed replace the commas with dots.