


Enables you to customize your view (what you see in the View panel). Most of these options are accessible through the Navigation Bar.
- Plots
Sets up what you want to see in the View panel.
- Plot Settings
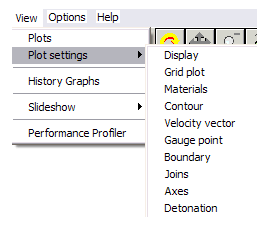
Lets you change settings for the various plot types that control how you view your model.
You can change settings for the following plot types:
Display
Grid
Materials
Contour
Velocity Vector
Gauge Point
Boundary
Joins
Axes
Detonation
- History Graphs
View histories of Gauge points and Material, Part and Energy summaries.
- Slideshow
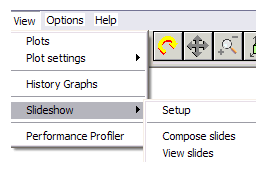
Creates and organizes slideshows (animations)
- Performance Profiler
Displays a performance profiler that lets you monitor your calculation.