The Color tab controls the color of objects in the viewer. The color can be either constant or based on a variable. Select one of the two options for Mode.
Select
Constantto specify a single color for an object. To choose a color, click the icon to the right of the Color
box.
icon to the right of the Color
box.Select
Variableto plot a variable on an object (maximum face angle on a plane, for example).Select
Use Plot Variable(available for some plots, including an isosurface) to color an object by the same variable used to define it.
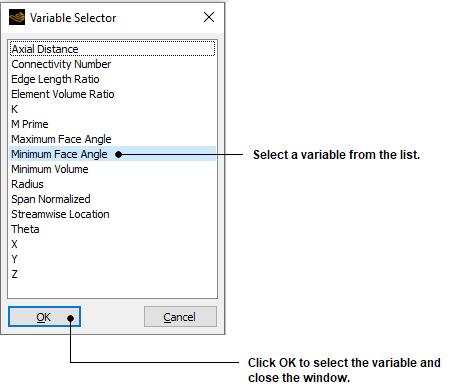
Choose the variable to plot from the Variable drop-down
list. The drop-down list of variables contains the most commonly used variables.
For a full list of variables, click the  icon.
icon.

Click  next to the Range
box to see the available methods for defining the range of the variable used to
define the plot. This affects the variation of color used when plotting the
object in the viewer. The lowest values of a variable in the selected range are
shown in blue in the viewer, the highest values are shown in red.
Globaluses the range of the variable over all domains (regardless of the domains selected on the Geometry tab) to determine the minimum and maximum values.Localuses the range of the variable over the current object to determine the minimum and maximum values. This option is useful for utilizing the full color range on the object.Using
User Specified, enter the minimum and maximum values for the contours. This option is useful to concentrate the full color range in a specific variable range. The variable values can be typed in, set using the embedded slider or, by clicking the icon to the right of the
Units box, entered as an expression. Click
  in the box to the right of the
variable value to see the available units for the variable(s).
Select whether the plotted object is based on hybrid or conservative values of the variable used for coloring.


