


After the calculation of a large set of trajectories (performed with Polyflow), you have to use Polystat in order to treat and / or visualize those results to obtain a global overview of the mixing process in the current flow.
To perform such statistical treatment several steps must be performed in a specific order: the main menu of Polystat appears as follows.
Note: The Help option summarizes this analysis process and gives information on the way to contact us if necessary (telephone, Email and fax number).
The major steps are the following:
In the File menu, you can read the results generated by Polyflow (the data necessary to Polystat).
In the Properties menu, you can ask the program to calculate new parameters evolving along the trajectories. For example, you can define any concentration field, or a new mixing index. These new parameters are always a combination of existing parameters (those calculated in Polyflow and stored in the mixing result files). You will see later the different possibilities accessible to you.
In the Trajectories menu, you can select a subset of trajectories on which you will perform the statistical treatment. For example, you can eliminate all the trajectories that terminated abnormally (for example, on a wall). You will see later the different possibilities accessible to you.
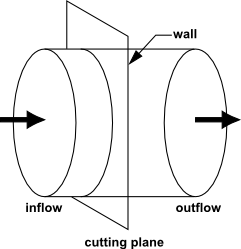
In the Slices menu, you determine the way to slice the selected trajectories. For example, suppose you are analyzing the flow through a cylinder, like the one shown in the following picture:
To analyze this flow, place a set of material points in the inflow section, and calculate their trajectory until they reach the outflow section. You will then cut the trajectories with planes disposed regularly from the entry to the exit (this is the slicing step). In each plane, you will calculate statistical functions. Those functions will evolve from entry to exit, and show the way the mixing changes.
Note: If the flow occurs in a closed domain, you want to know the time evolution of statistical functions and the slicing will be done on the time.
In the Statistics menu, you define the set of statistical functions that you want to calculate on the defined set of slices.
Return to the File menu, and click Run. By clicking this option, you order Polystat to calculate all of the desired data (new properties, the subset of trajectories, the set of slices, the set of statistical functions). This calculation can take a while to complete. Once the calculation is complete, you can analyze, visualize and store your results.
The following explains every Polystat menu, option, and dialog box, in detail.