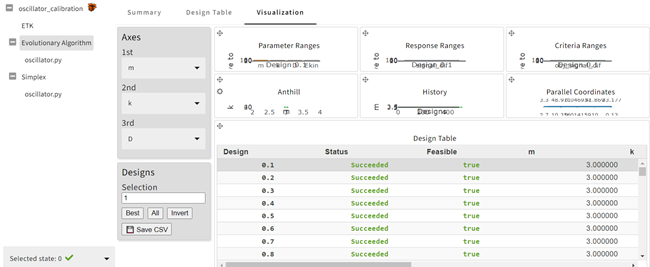
After a project is run inside optiSLang Web Service, you can access postprocessing plots on the Visualization page.
Note: The features used on this tab require a postprocessing (premium) license.
To use the Visualization page:
Click a node you want to see postprocessing for, then click .
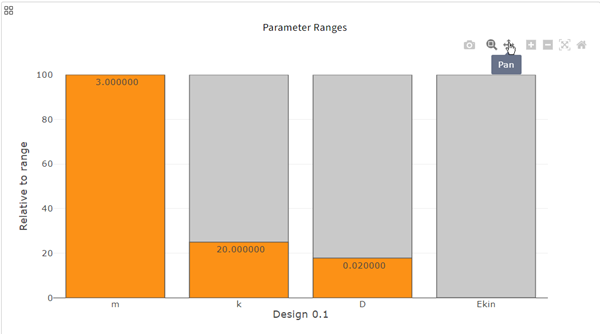
To manipulate a plot from the overview, hover over the plot and select a tool.

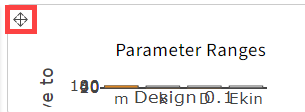
To expand a plot, click
 .
.
The plot is expanded to the fill the pane. You can hover over the right side of the plot to access manipulation tools.
To minimize the plot, click
 .
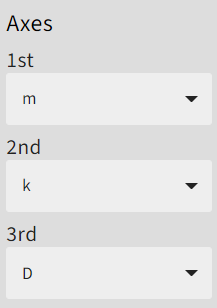
.To change the dimensions on the plot axes, select the 1st, 2nd, and 3rd, dimensions from the Axes lists.
To select which designs are displayed in the plots:
Click a row in the Design Table or enter the row number in the Selection field.
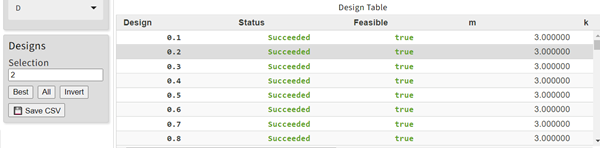
To select multiple adjacent rows, click a row in the design table, press Shift, then select another table row. You can also enter the row numbers in the Selection field separated by a hyphen (-).
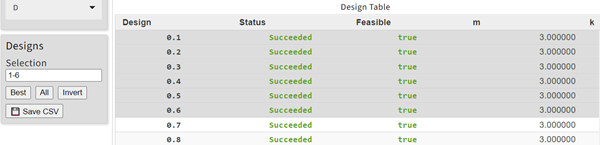
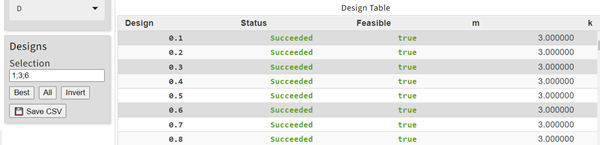
To select multiple non-adjacent rows, click a row in the design table, press Ctrl, then select one or more table rows. You can also enter the row numbers in the Selection field separated by a comma (,).
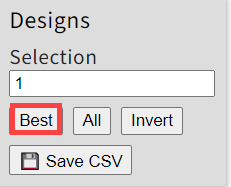
To select the best design, click .
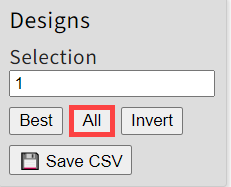
To select all designs in the table, click .
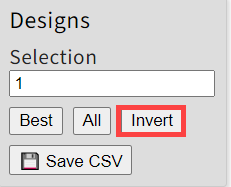
To change the selection to all currently deselected designs, click .
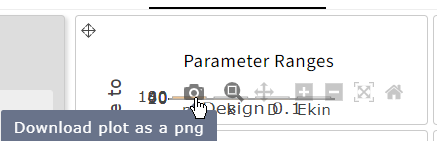
To save a plot as a PNG image, click the camera icon on the plot you want to save an image of.
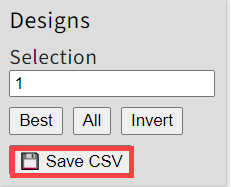
To save the design table as a comma-separated values (CSV) file, click .