The palette editor is a tool to create and modify palettes contained in the monitoring file, or to export and import them using the JSON file format. When you open the Palette editor dialog for the first time, only the optiSLang palette opens, set to be used as the default. When opening or creating new palettes, additional tabs are added. When you close the dialog, the palettes that were open are recorded and opened again the next time you open the dialog.
Each palette tab contains a header, displaying the name of the palette and the information about default ( [] ) and modification state ( * ).
A preview of the palette is displayed on the right side of the tab, showing the actual view. Every change on the content in the left side updates the preview.
In the middle there is a tabbed area with three tabs Colors, Ticks and Filters. Only the Colors tab is currently available.
General Saving Behavior
The Palette editor dialog stores a copy of the palette container from the monitoring file. Every change in a palette can be reverted by clicking . When you click or , the changes are sent to the monitoring file. You must save the monitoring file for newly created palettes and any changes you make to be permanently saved.
Palette Editor Controls
The following buttons appear at the bottom of the dialog:
| Button | Description |
|---|---|
| New | Creates a new palette. A small dialog is displayed for you to enter the palette name. |
| Open | Opens a palette already existing in the palette container. |
| Open from file | Opens a palette from previously exported JSON file. |
| Apply | Applies palette changes to postprocessing. |
| Cancel | Closes the dialog without making any changes to postprocessing. |
| OK | Applies palette changes to postprocessing and closes the dialog. |
Palette Tab Controls
These buttons are located on each palette tab and are applied only to that specific palette.
| Button | Description |
|---|---|
| Use as default | Uses the palette on this tab as the default and applies it to the postprocessing. |
| Reload | Reset the palette to the saved state. |
| Duplicate | Creates a new palette tab from the palette on this tab. A dialog opens, allowing you to create a new palette name. Preset palette content can only be modified when a duplicate is been made out of it. |
| Exports as Json | Exports the modifiable content to an readable ASCII file. |
| Remove | Removes the palette from the dialog, as long as it is not a preset. |
Colors Tab
Table
The table contains four standard rows:
larger
100%
0%
smaller
These rows cannot be removed and the values cannot be modified. When you create a new palette, these rows are added by default.
The table shows the values as percentile values, means only values between 0% and 100% are allowed.
You can move information around the table in the following ways:
Select a table row and then drag it to another location in the table. You cannot move the standard rows. Dragging a non-standard row onto the 0% row inserts it above that row.
Select a table cell and then drag it on top of another table cell. This exchanges the placement of the two cells. The value cells in the standard rows cannot be exchanged, but all other values and all of the color cells can be.
Buttons
| Button | Name | Description |
|---|---|---|

|
Add |
Adds a new row to the table. If one or more rows are selected, a new row is added below each selected row. If the 0% and/or smaller rows are selected, the new rows are added above the 0% row. |

|
Delete |
Deletes selected rows. This button is only enabled when a row between 0% and 100% is selected. |

|
Copy |
Copies selected rows. Copied rows are added below the selection, but above the 0% row. This button is only enabled when a row between smaller and larger is selected. |

|
Add new colors |
Opens a dialog where you can enter the number of new colors to add. To enable this button, select two cells in the Color column that are in adjacent rows (excluding the colors in the larger row and the smaller row. After clicking OK in the Input number of interpolations dialog, new rows are added to the color table with values and colors that are linearly interpolated between the two selected values and colors |

|
Sort |
Sorts the rows in the table by value, so that larger values end at the top of the table. Empty values are sorted at the bottom above 0%. The smaller, larger, 0%, and 100% rows are not sorted. |

|
Invert Order |
The colors of first and last row, as well as the colors of second and second-to-last row are exchanged. For the rest of rows, the value is recalculated (n_new = 100%-n). |

|
Invert Colors |
All colors are recalculated for each color component (v_new = 255-v). For example, red (255,0,0) becomes cyan (0,255,255), black becomes white, and so on. |
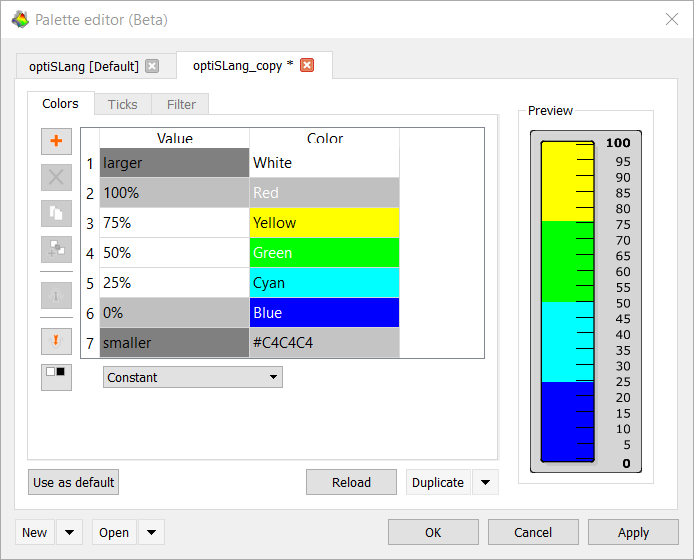
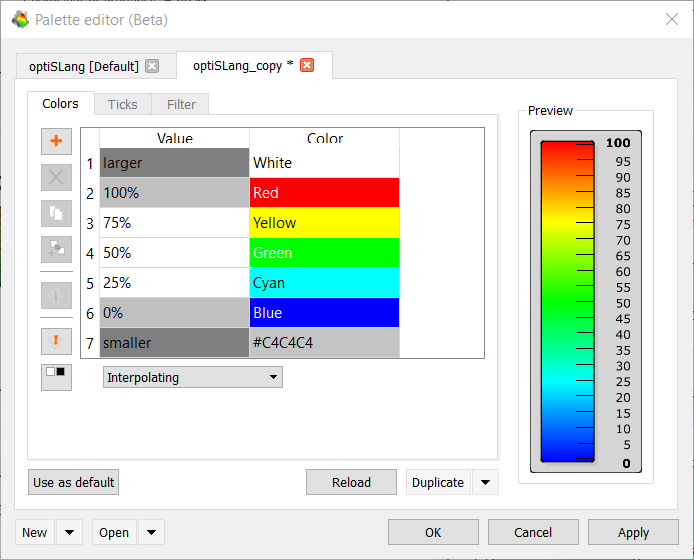
Interpolating or Constant
When is chosen from the drop-down menu, colors are linearly interpolated between two nearby entries in table.
When is chosen, all colors are modified to be constant up to the next color. The color for the 100% row is ignored, you cannot change or move this color cell.
For example, in the duplicate of an optiSLang palette, only four colored areas are displayed in the palette.