When the Fatigue Diagram is evaluated or selected in the tree item, it will be displayed as shown below:
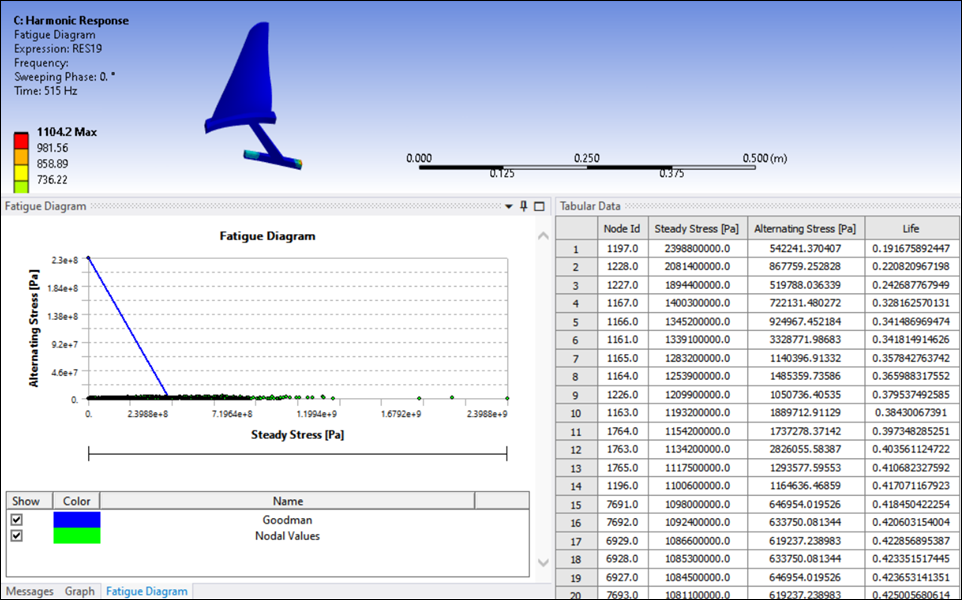
Here are some key properties in the Details panel of the Fatigue Diagram post-processing object:
Set Stress Component to either Equivalent (Von-Misses) or Maximum Principal.
Define the Frequency Range for the alternating stresses. One or several frequencies may be picked to calculate the alternating stresses.
Set the Result Part to either Real, Imaginary, Amplitude, Maximum Values Across Phase Angle, or Phase Angle.
The static stresses come from the Static Structural analysis. If more than one load step is present in the Static Structural system, a different load step may be selected.
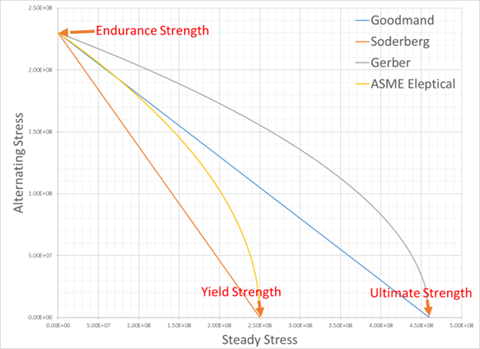
The material data strength creates the fatigue line and calculates the life. The available Mean Stress Theory options and their formulas are:
Goodman:

Soderberg:

Gerber:

ASME Elliptical:

where n is the life, δα is the alternating stress, δm is the steady stress, Se is the endurance strength, Sy is the yield strength, and Sut is the ultimate strength.
The Mean Stress Theory can be set to Custom. You must define steady vs. alternating stress limit tabular data.