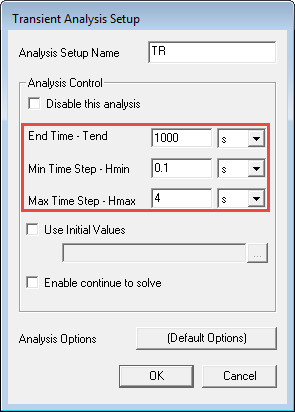
In the Project Manager, expand Analysis and double-click TR to open the Transient Analysis Setup dialog.
Under Analysis Control, do the following:
Note: Ensure that you select second as the unit for the following entries.
For End Time - Tend, enter 1000 s.
For Min Time Step - Hmin, enter 0.1 s.
For Max Time Step - Hmax, enter 4 s.
Click OK to close the Transient Analysis Setup dialog.
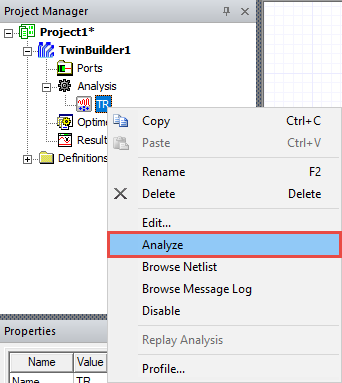
In the Project Manager, right-click on TR and select Analyze.
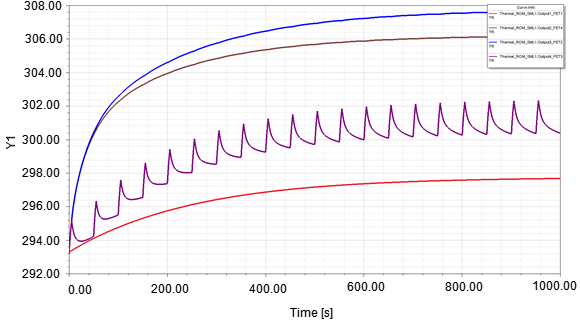
Under Results, select the XY Plot to display the temperature change.
Note: Temperatures are dispalyed in Kelvin. The XY plot created is based on both step responses created by Icepak and the inputs of Twin Builder.