The list content provided to an input variable determines if it is set to a constant value or to Tabular Data. If the list contains only one quantity, the input is set to this constant value. If the list contains multiple quantities, the input is set to Tabular Data.
Note: Input values for a discrete variable must be in a sorted order as shown in this example:
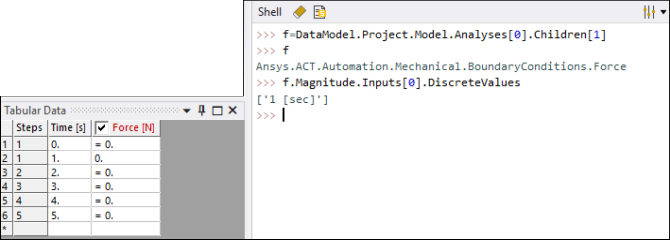
Pressure.Magnitude.Inputs[0].DiscreteValues = [Quantity("0 [s]"), Quantity("1 [s]"), Quantity("2 [s]"), Quantity("3 [s]")]
Getting Discrete Input Values
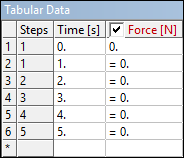
You can get the discrete input values for a given input variable. For example, a
force in a five-step analysis looks similar to the following figure by default. The
six rows in the Tabular Data window correspond to the discrete
values of the input variable, time, with
0 seconds as the start time of the first step and
5 seconds as the end time of the last step.
Setting Discrete Input Values
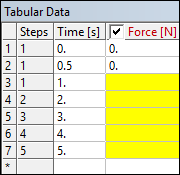
You can change discrete values for a given input variable. For example, the following code sample adds a discrete value, inserting a value of 0.5 seconds without defining an additional step in the analysis:
f.Magnitude.Inputs[0].DiscreteValues = [Quantity("0[sec]"),Quantity("0.5[sec]"),Quantity("1[sec]")]
In the figure that follows, you can see that:
A new row exists for 0.5 seconds.
The output cells for rows 3 through 7 have a yellow background. This is because values have not been set for the output variable.
Removing Discrete Values
You can also remove a discrete value, deleting a row by defining a shorter list of values for the input variable. In the line of code that follows, the list specifies a single value, indicating that the other rows should be removed:
f.Magnitude.Inputs[0].DiscreteValues = [Quantity("0[sec]")]
In the Tabular Data window, only six rows now show once again. The value =0 is actually a repeat of the value in the first row and does not correspond to an actual value stored for the variable. This is because the tabular data in Mechanical always displays a row for time values that correspond to step end times.