


Regardless of whether you intend to debug scripts in the ACT Debugger or in Microsoft Visual Studio, you must first enable debug mode. To accomplish this, from the Workbench menu, you select > > and then select the Debug Mode check box. You can also select this check box in the settings that become available when you click the gear icon in the graphic-based Extension Manager, which is started from the ACT Start Page.
Once debug mode is enabled, you can debug extensions. To help you debug, the debug mode exposes the following features:
In Workbench, the Reload Extensions button displays so that you can easily reload all loaded extensions.

In DesignModeler, the ACT Development toolbar displays. Clicking the second button reloads all loaded extensions. The other buttons open the ACT Console, the Extensions Log File, the ACT Debugger, and help panel provided on the ACT Start Page.

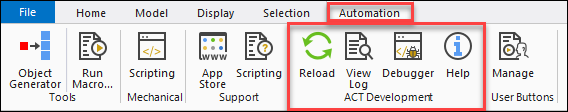
In Mechanical, the ACT Development group displays on the ribbon's Automation tab. This first button in this group reloads all loaded extensions. The other buttons open the Extensions Log File, ACT Debugger, and help panel provided on the ACT Start Page. To the left, the ACT group includes a button for opening the ACT Console. To the right of the Automation tab are tabs for any loaded extensions.
Access points for debugging are provided in DesignModeler, Mechanical, and the Workbench Project tab.
In the Workbench Project tab, debug mode is enabled as soon as you select the Debug Mode check box. Currently, you cannot debug scripts on the Linux platform.
In DesignModeler and Mechanical, debug mode is not enabled until you restart the product. After selecting the Debug Mode check box, you must exit and restart the product to make debugging functionality available.
When debug mode is enabled, you can use a debugger to observe the run-time behavior of IronPython scripts in loaded extensions. You typically use a debugger to either verify that correct values are being stored for variables or determine why an exception is thrown. Once you have finished debugging a scripted extension, you can use the binary extension builder to compile it into a binary extension (WBEX file) that you can share with others.