


Watches refer to variables and expressions that you have chosen to observe and evaluate as the script executes. In the Watch Expressions tab, you add the specific variables or expressions that you want to watch during debugging by typing their names in the Name column of empty rows.
As you advance the debugger through the execution of the script, you use this tab
to see how values change for the available watched variables. For the extension
DebuggerDemo, assume that you have finished setting up
the geometry in the Project Schematic. In the
Outline view in Mechanical, you can right-click
Solution in the tree and select > .
To debug the script that Mechanical executes, you must first detach from the Workbench Project tab and close the debugger. You must then start the debugger from Mechanical and click the button in the debugger toolbar for attaching to Mechanical.
To have the debugger pause where the callback <evaluate>
is adding the custom debugger result to the Mechanical tree, you can insert a
breakpoint at the line where the result values are collected. In the
Outline view in Mechanical, you then right-click
Solution again and select Evaluate All
Results to invoke the callback
<evaluate>.
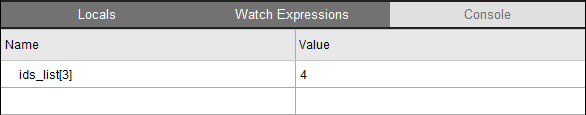
When the debugger pauses where the results values are collected, in the
Watch Expressions tab, you can enter
ids_list[3] in the Name column to
see the index 3 value as the script executes:
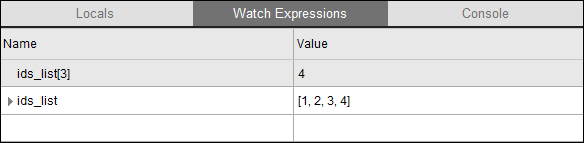
To view the entire list of values for this IDs list, you can type the name for the variable in the Name column and then watch as the values populate:
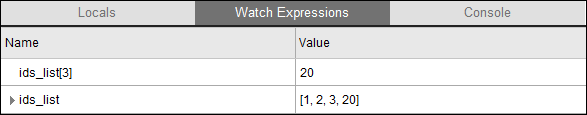
In the Console tab, you can directly manipulate this
variable. After entering ids_list to access the list values,
you can enter ids_list[3]=ids_list[3]*5 to multiply the index
3 value by 5, changing it from 4 to 20. Entering ids_list
again would allow you to see the changed value.

In the Watch Expressions tab, the value for the index 3 value changes accordingly:
You can navigate through the variables that you've added in the Watch
Expressions tab and in some cases modify values in the
Value column to see the effect. For example, for
ids_list(3), rather than programmatically changing the
value in the Console tab, you can change the value for
ids_list[3] directly to 20 in the
Value column.
Any variables that cannot be set in the Watch Expressions tab are grayed out. If an expression has a syntax error, the Value column displays the same compiler error as you would see when entering this command in the console.