


Analyze drop-down
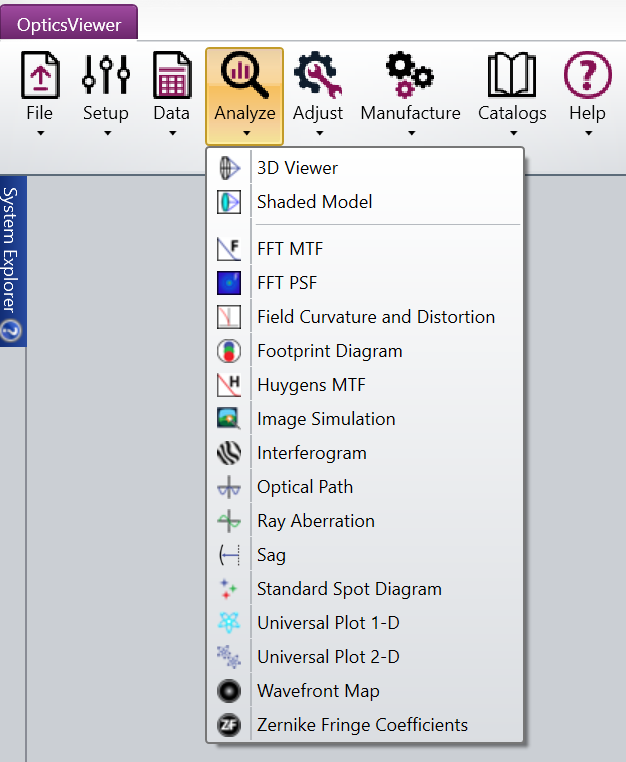
This tab provides access to OpticsViewer's most commonly used analysis capabilities.
3D Viewer: Draws 3D layout plots of the lens system. The algorithm draws a wireframe style representation of the lens. See also 3D Viewer.
Shaded Model: Draws a shaded solid representation of the lens. See also Shaded Model.
FFT MTF: Computes the diffraction modulation transfer function (MTF) data for all field positions using an FFT algorithm. See also FFT MTF.
FFT PSF: Computes the diffraction point spread function (PSF) using the Fast Fourier Transform (FFT) method. See also FFT PSF.
Field Curvature and Distortion: Displays the field curvature and distortion plots. See also Field Curvature and Distortion.
Footprint Diagram: Displays the footprint of the beam superimposed on any surface. Used for showing the effects of vignetting and for checking surface apertures. See also Footprint Diagram.
Huygens MTF: Computes the diffraction modulation transfer function (MTF) data using a Huygens direct integration algorithm. See also Huygens MTF.
Image Simulation: Simulates the formation of images by convolving a source bitmap file with an array of Point Spread Functions. The effects considered include diffraction, aberrations, distortion, relative illumination, image orientation, and polarization. See also Image Simulation.
Interferogram: Generates and displays interferograms. See also Interferogram.
Optical Path: Shows optical path difference as a function of pupil coordinate. See also Optical Path Difference.
Ray Aberration: Shows ray aberrations as a function of pupil coordinate. See also Ray Aberration.
Standard Spot Diagram: Traces bundles of rays through the system to the specific surface to show ray distributions. See also Standard Spot Diagram.
Sag: Displays the sag of a surface as a 2D color or contour map, or as a 3D surface plot. See also Surface Sag.
Universal Plot 1-D: Displays as either a plot or as a text listing the value of any optimization operand as a function of one other parameter. See also Universal Plot 1-D.
Universal Plot 2-D: Displays as either a plot or as a text listing the value of any optimization operand as a function of two other parameters. See also Universal Plot 2-D.
Wavefront Map: Displays the wavefront error across the pupil. See also Wavefront Map.
Zernike Fringe Coefficients: Calculates the Zernike coefficients using the Fringe polynomials. See also Zernike Fringe Coefficients.
Toolbar Button Functions: A list of all toolbar icons and their associated functions
Next:
- 3D Viewer
- Shaded Model
- FFT MTF
- FFT PSF
- Field Curvature and Distortion
- Footprint Diagram
- Huygens MTF
- Image Simulation
- Interferogram
- Optical Path Difference
- Ray Aberration
- Standard Spot Diagram
- Surface Sag
- Universal Plot 1-D
- Universal Plot 2-D
- Wavefront Map
- Zernike Fringe Coefficients
- Toolbar Button Functions