


Source Spectrum Plot
This feature is only available in the Premium and Enterprise editions of Ansys Zemax OpticStudio.
Displays the relative intensity vs. wavelength for a defined spectral distribution.
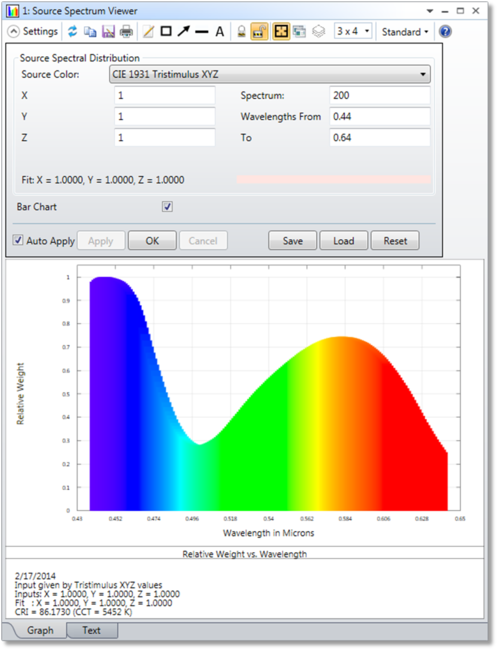
Source ColorThe model used to define the spectral distribution of the source. The ten options provided for the source color model are described in "Defining the color and spectral content of sources".
X, Y, Z; x, y; R, G, B; Temp (K); u'v'Six of the models require additional numeric inputs for characterizing the source color. The appropriate inputs should be entered based on the selected model (e.g. X, Y and Z values for the CIE 1931 Tristimulus XYZ model). No additional numeric inputs are required for the System Wavelengths, Uniform Power Spectrum, D65 White, or Spectrum File models. For any model requiring additional numeric inputs - other than Black Body Spectrum - OpticStudio must perform fitting to determine the corresponding spectrum (this fitting is also required for the D65 White model). More details on the fitting algorithm are provided in "The spectrum fitting algorithm" .
SpectrumThe number of wavelengths to use in characterizing the spectral distribution of the source. The user has no control over this option when selecting the System Wavelengths or the Spectrum File models (though in the latter case the appropriate value from the spectrum file will be read into the dialog).
Wavelengths FromThe minimum wavelength (in microns) to use in characterizing the spectral distribution of the source. The user has no control over this option when selecting the System Wavelengths or the Spectrum File models (though in the latter case the appropriate value from the spectrum file will be read into the dialog).
ToThe maximum wavelength (in microns) to use in characterizing the spectral distribution of the source. The user has no control over this option when selecting the System Wavelengths or the Spectrum File models (though in the latter case the appropriate value from the spectrum file will be read into the dialog).
Spectrum FileThe name of the file containing the spectral data for the source. This option is only available when selecting the Spectrum File model. More information on the file format is provided in "Defining a spectrum file" in the Sources section of the Object Properties.
Bar ChartIf selected, the data will be displayed as a bar chart.
Discussion
This feature is used to visualize the spectral distribution of a source defined in non-sequential mode. The distribution may be defined according to any one of ten models, each of which are described in detail in "Defining the color and spectral content of sources" . The results are shown as either check marks or bars at each of the discrete wavelengths for the distribution. The check marks or bars are colored according to the closest RGB value for the corresponding wavelength (if no RGB value exists for a particular wavelength a black color is used for that data point). More details on how the wavelengths and weights are determined for any given source color model may be found in "The spectrum fitting algorithm" . The input distribution and the Tristimulus values corresponding to the fit for that distribution (as determined by the spectrum fitting algorithm) are displayed in the text section of the analysis. At the bottom of this section are the Color Rendering Index (CRI) and Color Correlated Temperature (CCT) for the distribution.
Next: