


Physical Optics Propagation

This feature propagates an arbitrary coherent optical beam through the optical system. For a complete description of this feature see " About Physical Optics Propagation "
The Physical Optics Propagation feature results are generally not accurate for systems including non-sequential component groups; see " Propagating through non-sequential surfaces " for more information. For the most accurate results, replace non-sequential component groups with sequential equivalents.
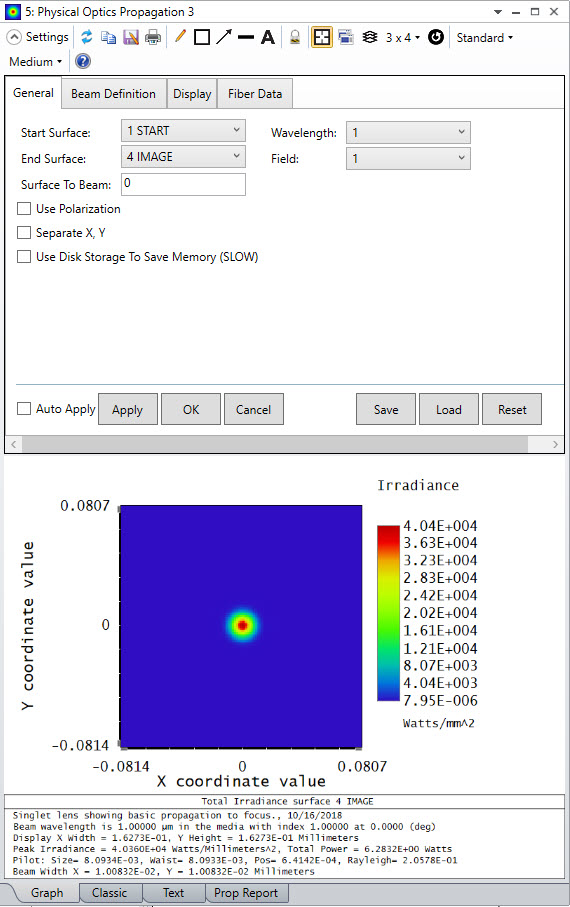
General Tab
Start Surface The starting surface for the initial beam. The beam will begin in the optical space just prior to the starting surface.
The entrance pupil may be used as the starting surface. If the system is telecentric in object space, then surface 1 will be used as the starting surface even if the entrance pupil is selected.
Start Surface cannot be a Zemax Black Box surface.
End Surface The surface at which to terminate the propagation. The beam will stop just after entering the optical space of the end surface.
End Surface cannot be a Zemax Black Box surface.
Wavelength The wavelength number to use for the beam.
Field The field number of the chief ray used to align the initial beam.
Surf to Beam The distance from the starting surface to the starting beam position in lens units. This value is negative if the beam starts to the left of the surface.
Use Polarization If checked, 2 beam arrays will be propagated, one each for the X and Y polarizations of the beam. If the Initial Beam is defined by a .ZBF file, then the polarization details will always be set based on the information saved in the file. If "Unpolarized" is selected in the System Explorer under " Polarization (system explorer) " and Use Polarization is checked, then 2 beams with orthogonal polarization are propagated and the output is averaged. Because these 2 beams cannot be coherently summed, any complex field data for the output (i.e. real, imaginary, or phase data) will be set to zero.
Separate X, Y If checked, the X and Y directions are propagated independently. This allows much more efficient sampling if the beam is astigmatic or the optics are cylindrical or toroidal. See "Separation of X and Y Propagation". Note this option must be checked when calculating M-squared value for asymmetric beams. See "Beam with and M-squared".
Use Disk Storage To Save Memory See " Memory requirements " for a discussion.
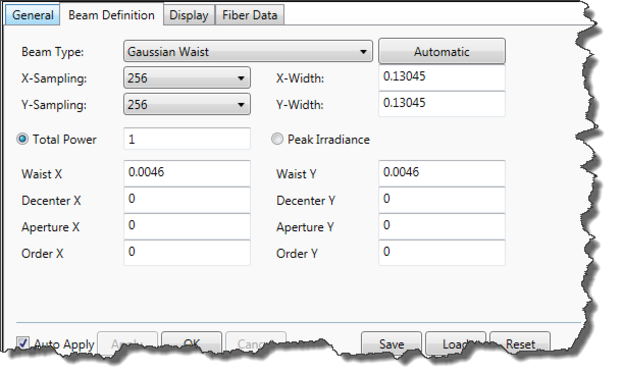
Beam Definition Tab
X- Y- Sampling The number of points used to sample the beam.
X- Y- Width The initial width in lens units of the region represented by the array. See Auto below.
Auto Pressing this button will calculate the optimum X- and Y- Width values to maintain the approximately the same number of pixels across the beam both within and outside the Rayleigh range. See "Comments about point spacing and sampling".
Type See the discussion and "Defining the initial beam".
File See the discussion and "Defining the initial beam".
Peak Irradiance The initial beam peak irradiance in power per area. This is an alternative to Total Power.
Total Power The initial beam total power. This is an alternative to Peak Irradiance.
Read power from file If the beam type is File, pressing this button will read the current power and peak irradiance values from the selected file.
Parameters Different initial beam types require various parameters to define the distribution. These parameter names and values will change depending upon the beam type setting. For details, see " Defining the initial beam ".
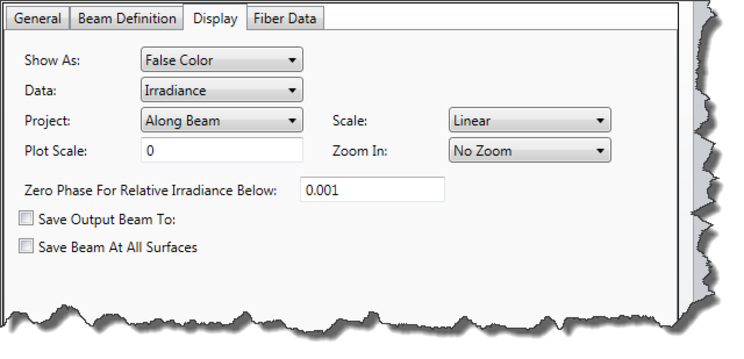
Display Tab
Show As Choose surface, contour, false color, grey scale, cross sections, encircled, ensquared, or enslitted displays. Note that the encircled energy is a function of radius; and the ensquared and enslitted widths are the half widths.
Row/Column If cross section is chosen for Show As, this control selects the row or column to view.
Data Choose irradiance (beam power per area), phase (of the beam), transfer function intensity, or transfer function phase. The Ex and Ey refer to the X and Y polarization components of the beam. The transfer function values are the intensity and phase of transmission for the final surface only; these are primarily used for debugging and analysis of the POP results. For the phase data setting, the "phase" is always the EX phase, even in cases when the energy in the beam is only in the Y direction.
The data may be viewed graphically, or as text. Select the Graph or Text tab at the bottom of the analysis to change views. In addition to the Graph and Text output, a Prop Report (propagation report) is also available. The propagation report lists various data about the propagation algorithm parameters used, the orientation matrix for the pop results, and may contain warnings that indicate if a possible inaccuracy is detected in the results.
Scale Choose linear or logarithmic scaling of the data. Logarithmic scaling only applies to irradiance data on graphical (not text) displays.
Project The beam may be viewed from any one of these perspectives: along the beam (this is along the chief ray used by the pilot beam), along the surface normal, or along the local Z axis of the surface. Note ZBF beam file data is always "along the beam". See the comments about beam projection below.
Save Output Beam To If checked and a file name is provided, the complex amplitude of the beam at the end surface will be written to a file. This file can be read back in as a starting beam using the Beam Type control. OpticStudio will add the extension "ZBF" to the provided file name. ZBF files are stored in the <pop> folder (see " Folders ").
Save Beam At All Surfaces If checked, the beam file will be saved at every surface from the start surface to the end surface that uses the physical optics propagator. The "Save Output Beam To" option must also be checked and a file name provided. The individual surface beam files will be named according to the provided file name, with a suffix indicating the surface number.
If "Use Polarization" has been selected under the General Tab and the input beam is unpolarized (i.e. no specific polarization state has been provided in the " Polarization (system explorer) " input of the System Explorer), then individual surface beam files will be provided for each of two orthogonal beams that are propagated to model the unpolarized beam, and an additional suffix will be added to the file name to differentiate between the two beams.
For example, if the output file name is "MyBeamData.ZBF", then the beam file name for surface 12 will be "MyBeamData_0012.ZBF" if either "Use Polarization" has not been selected, or if "Use Polarization" has been selected but the input polarization state has also been specified in the System Explorer. If "Use Polarization" has been selected and no specific polarization state has been specified in the System Explorer, then in the above case two files would be generated on surface 12, named "MyBeamData_0012_1.ZBF" and "MyBeamData_0012_2.ZBF". ZBF files are stored in the <pop> folder (see Folders ).
Zero Phase For Relative Irradiance Below Phase values are meaningless if the irradiance is extremely low. Computing the phase angle of data points with nearly zero irradiance (relative to the peak irradiance in the beam) will result in noisy plots and text listing of meaningless data. This value sets the lower limit on the relative irradiance of data points for which the phase is computed. Data points with relative irradiance lower than this threshold will have a phase value of zero.
Plot Scale If zero, the vertical scale on false color, grey scale, and cross section plots will be set by the maximum data value, or for log plots, the next largest power of 10. Otherwise, the maximum vertical scale is set by the normalization value. If a log plot is generated, the maximum scale is set by the next largest power of 10 greater than the plot scale value.
Phase plots always scale from -pi to pi.
Contour Format The contour format string. For a discussion of the contour format string syntax, see "The Contour Format String" . The contours are defined in the same units as the data being displayed.
Zoom In Magnifies the displayed area of the beam. This is useful for eliminating some of the guard band from the displayed beam data.
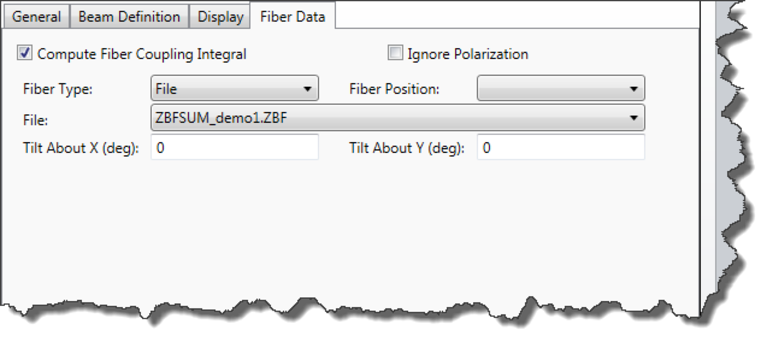
Fiber Data Tab
Compute Fiber Coupling Integral If checked, the fiber data on this tab will be used and the fiber coupling computed; otherwise, no fiber coupling computations will be performed. See " Computing Fiber Coupling ".
Ignore Polarization If checked, the fiber mode will be unpolarized even if the beam itself is polarized. If unchecked and the beam is polarized, then the fiber coupling overlap integral is computed for the two orthogonal polarizations independently and the results combined to yield the overall coupling. See " Defining the fiber mode ".
Tilt About X/Y (deg) The tilt about each axis in degrees of the fiber mode with respect to the beam. The phase of the fiber mode will be modified with a linear tilt proportional to the tilt angles.
Fiber Type Selects the mode for the fiber. See " Computing Fiber Coupling ".
File Selects the name of the DLL or data file describing the fiber mode. See " Computing Fiber Coupling ".
Parameters Different fiber mode types require various parameters to define the mode. These parameter names and values will change depending upon the fiber type setting.
Fiber Position The center of the receiving fiber may be referenced to the surface vertex or to the chief ray. The incoming POP beam is referenced to the chief ray position and angle.
Discussion
For a full discussion of physical optics propagation, see " About Physical Optics Propagation "
Comments about beam projection
The analysis computes the beam irradiance or phase on a plane tangent to the chief ray at the point where the chief ray intercepts the surface. The orientation matrix of the plane may be determined from the propagation report. The irradiance or phase data is shown after the beam refracts into, or reflects from, the end surface. The chief ray representing the center of the beam will generally intercept the surface at some angle of incidence other than zero, and the surface normal will generally be at some angle to the local Z axis. Using the "project" option on the "display" tab, the beam data may be viewed along the beam, along the surface normal, or along the local Z axis. The latter two options are implemented by elongating the beam along the local X and Y directions in an independent manner based on the cosine of the angle between the beam and the desired projection.
The beam itself is always represented by the data array in a coordinate system normal to the chief ray. For this reason, the beam projected onto a surface by this feature may be elongated compared to the same beam stored as a file and viewed with the Beam File Viewer, see "Beam File Viewer".
Beams in OpticStudio are always centered on the chief ray for the selected field and wavelength. Therefore, the data in the beam file is positioned relative to the chief ray.
The center point in the beam file is at the coordinate (nx/2+1, ny/2+1).
The analysis window may include some of the following data:
- Display X Width/ Y Height: The width and height of the beam array in lens units at the end surface.
- Peak Irradiance: The maximum irradiance in power per area. To set the power and area units see "Units"
- Total Power: The total power in the beam. To set the power units see "Units".
- Pilot Beam Data: The Pilot Beam data includes the radial beam size, beam waist, position, and Rayleigh range. For detailed information on the Pilot Beam see "The pilot beam".
- Beam Width: The X, Y beam width calculated using second moment method. See "Beam width and M-squared".
- Fiber Coupling: If "Compute Fiber Coupling Integral" is checked, then the fiber coupling is computed and displayed. The system efficiency is the fraction of beam power that transmits from the starting surface to the surface at which the fiber coupling is computed. The receiver efficiency is the fraction of the power in the beam mode that couples into the fiber mode. The total coupling efficiency is the product of these two numbers. For more information, see " Computing Fiber Coupling "
High sampling support
The highest X- and Y-Sampling allowed for the beam in the OpticStudio user interface is 16,384. Higher sampling support is available via the ZOS-API however, up to a maximum of 1,073,741,824 by 1,073,741,824 pixels (available RAM permitting). For more information see 'RunHighSamplingPOP' on the I_Analyses interface in the ZOS-API Syntax Help.
Next: