


Optical Path Difference

Shows optical path difference as a function of pupil coordinate.
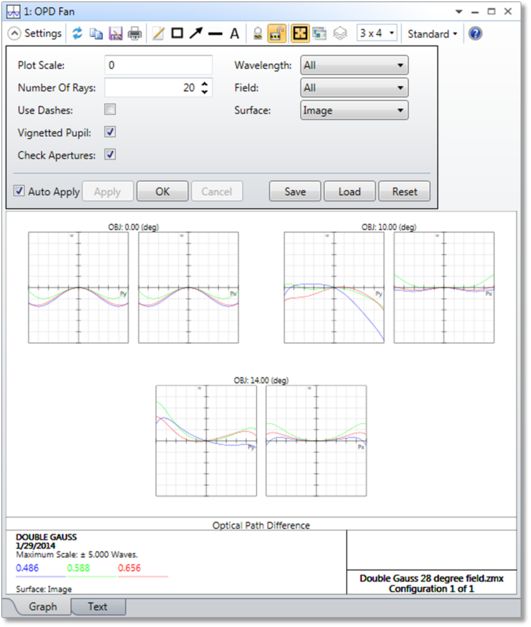
The options are identical to those for ray aberration fans, except the only option for "Tangential" and "Sagittal" is OPD, since OPD is a scalar quantity.
Discussion
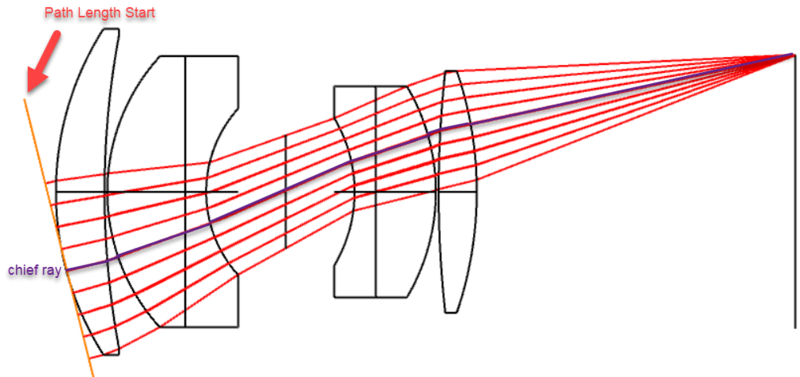
The vertical axis scale is given at the bottom of the graph. The data being plotted is the optical path difference, or OPD, which is the difference between the optical path length of the ray and the optical path length of the chief ray. Usually, the calculation is referenced back to the difference between the ray path lengths at the system exit pupil. For more information see Reference OPD. The horizontal scale for each graph is the normalized entrance pupil coordinate.
If "All" wavelengths are shown, then the plot is referenced to the primary wavelength based reference sphere and chief ray. The resulting OPD values, however, are in terms of waves of each respective wavelength. If monochromatic, then the reference sphere and chief ray for the selected wavelength is used as a reference. For this reason, the data for non-primary wavelengths could change when switching between monochromatic and polychromatic displays.
For infinite conjugates, a plane phase reference is defined at the chief ray intercept of the first surface. This plane reference is oriented normal to the chief ray; the wavefront is a plane wave and the phase zero point is arbitrary. The optical path length starts from this plane phase reference.
Evaluating results at intermediate surfaces
OpticStudio can compute analysis results for surfaces other than the image surface by applying assumptions. These assumptions work in most cases, however, there may be cases where the methods described here for analyzing intermediate surfaces are not appropriate, including systems which require ray aiming. All of the changes made to the lens described are made on a copy of the original lens data made for analysis purposes so no changes are made to the original lens data.
If the field type is either real or paraxial image height, the field type is changed to angle or object height for infinite or finite conjugate systems, respectively. The angles and heights used correspond to the primary wavelength chief ray angles and heights as computed for the unaltered system.
If the selected surface precedes the stop surface, OpticStudio moves the stop surface to a (possibly virtual) dummy space prior to the existing surface 1. Unless the system aperture is object space numerical aperture or cone angle, the system aperture is changed to entrance pupil diameter, and the aperture value is set equal to the original paraxial entrance pupil diameter computed for the original stop position. Note this assumption might not be valid for systems that require ray aiming. If the selected surface follows the stop surface, no changes are made to the system aperture or stop definitions.
Surfaces which follow the selected surface are then deleted. The glass of the new image surface is set to be the same as the selected surface.
Most analysis features that compute results for focal mode systems make more sense if the rays are allowed to come to a focus after refraction from the desired surface. For example, the OPD plot is generally a useful diagnostic only when the OPD is measured at the (possibly virtual) focus of that surface. Other features which require a temporary image to be formed include PSF, MTF, and diffraction encircled energy. For these features requiring a temporary image, the new image surface is set to be a standard plane surface. A paraxial marginal ray height solve is placed on the selected surface thickness to place the image surface at paraxial focus for the selected surface. The analysis computation then proceeds at this newly created intermediate image surface. Note the analysis occurs at the paraxial focus formed by the rays after refracting through the selected surface. This shift to paraxial focus is not performed if the intermediate system is in afocal mode.
For more information on afocal mode see "Afocal Image Space" in the Aperture section of the System Explorer.
Some analysis features make more sense if the data is evaluated directly on the surface itself, without allowing the rays to focus to an image. These features include the various spot diagrams, footprint analysis, geometric encircled energy, line/edge spread function, and extended source encircled energy.
Next: