


Seidel Diagram

Displays Seidel unconverted aberration coefficients as a bar chart.
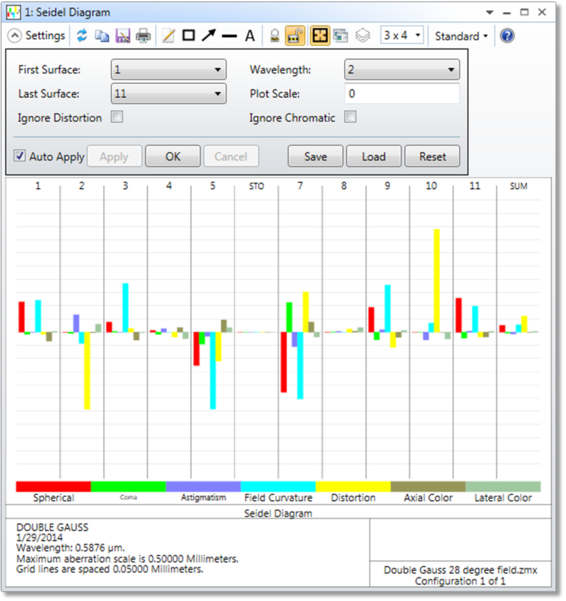
First/Last Surface The surface range to display. The sum is for the selected range of surfaces. The image surface is not displayed.
Wavelength The wavelength number to use for the calculation.
Plot Scale Sets the maximum scale in lens units for the plot. Enter zero for automatic.
Ignore Distortion If checked, distortion data will not be displayed.
Ignore Chromatic If checked, axial and lateral color data will not be displayed.
Discussion The unconverted Seidel coefficients are displayed surface by surface, as well as a sum for the selected range of surfaces. For details on the Seidel coefficients, see "Seidel Coefficients"
Next: