


Phase Slope

Displays the slope of a phase surface as a 2D color or contour map, or as a 3D surface plot.
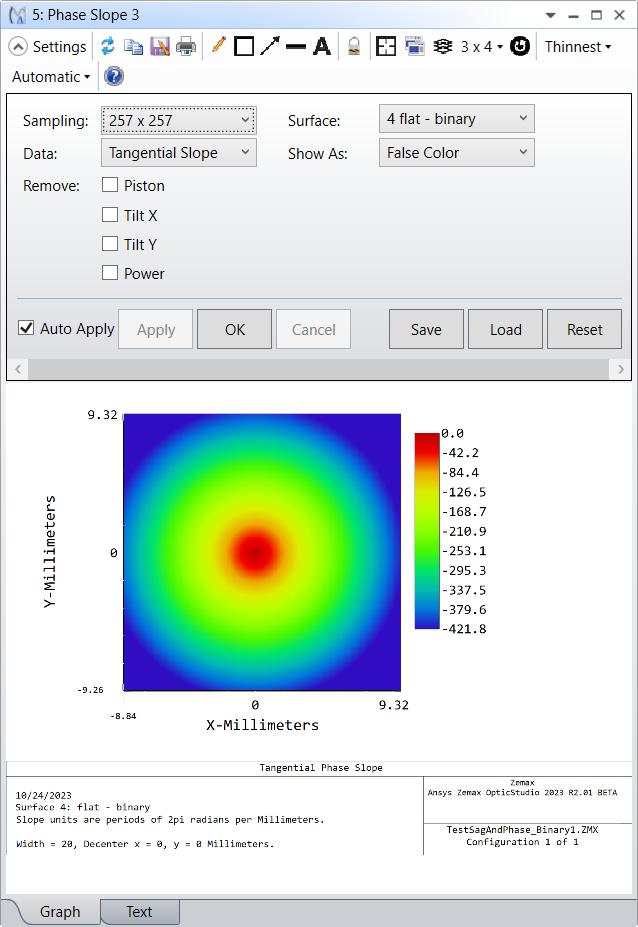
Sampling The size of the grid used. The sampling may be 33x33, 65x65, etc.
Contour Format The contour format string. For a discussion of the contour format string syntax, see in The Contour Format String .The contours are defined in periods, each period is a phase change of 2π .
Modulo-2pi If this is ticked, whenever the plot reaches a 2pi phase shift, it will restart the phase plot. This option will draw the locations of the 2pi zones.
Surface The surface number at which the phase will be computed and displayed.
Data Choose the direction for the slope calculation: Tangential Slope, Sagittal Slope, X Slope, or Y Slope, or Modulus. Modulus is defined as the maximum length of the slope vector.
Show As Choose surface plot, contour map, grey scale, or false color map as the display option.
Remove The Remove selection gives the option to remove "Piston", "Tilt X", "Tilt Y", and "Power". These terms are calculated using a Zernike decomposition.
DiscussionThis feature accounts for the size and shape of any aperture present on the surface, even if the aperture is decentered. The phase slope is computed on a uniform grid of points in XY plane, and the phase slope value is the displayed data. This feature defines phase slope in units of 2pradians per lens unit at the primary wavelength. Surfaces which do not impart a phase change to the ray, such as the Standard surface, will display a phase of zero everywhere on the surface phase display.
Next: