


Glass Map
Plots names of glasses on map according to the d-light index of refraction and Abbe V-number. The index and Abbe number are computed from the data in the glass catalog. All currently loaded glass catalogs are searched, and glasses within the boundary values specified in the following table are plotted.
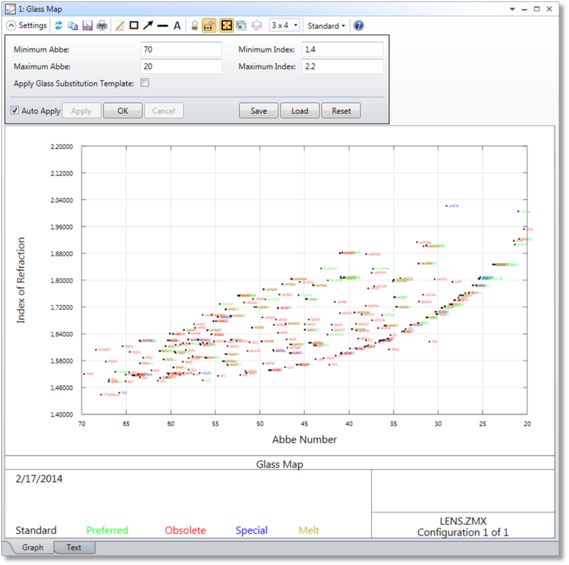
Min AbbeDefines the left X- axis of the plot.
Max AbbeDefines the right X- axis of the plot.
Min IndexDefines the bottom Y- axis of the plot. Enter zero for automatic scaling.
Max IndexDefines the top Y- axis of the plot. Enter zero for automatic scaling.
Apply Glass Substitution TemplateIf checked, only glasses that meet the glass substitution template will be shown.
See "Glass Substitution Template (materials tools)".
Discussion
This is useful for locating a glass with particular refractive and dispersive properties. By convention, the glass map is shown with the Abbe number decreasing while going from left to right, which is why the default min and max Abbe numbers seem to be reversed.
Next: