


Confidence Score
The Confidence score serves as an indicator of the AI’s confidence in the prediction. This metric helps you assess the confidence of the AI model with regard to the input geometry and its associated variables. It is not a proxy to estimate the quantitative error of the model.
What is a Confidence Score
A confidence score measures how certain the system is about its prediction, based on what it has learned from past data.
A 90% confidence score does not guarantee correctness but suggests the model has seen similar past patterns that led to this answer frequently.
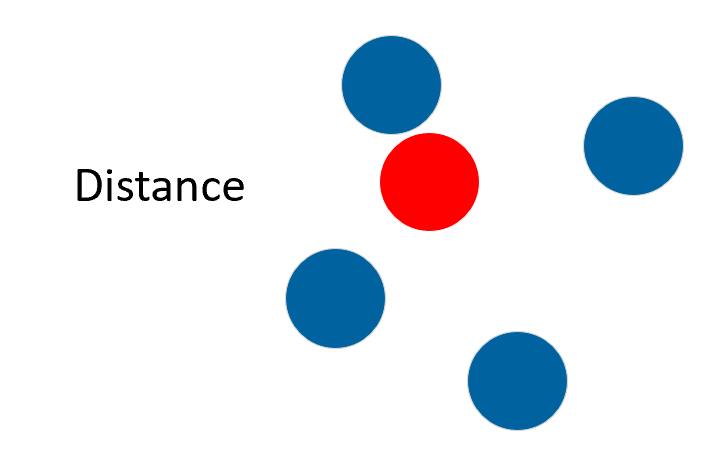
- "Similarity/Distance" to training examples in the input parameter space.
- "Output variability" in nearby training examples, even in regions with nearby training data, high variability can reduce confidence.
 |
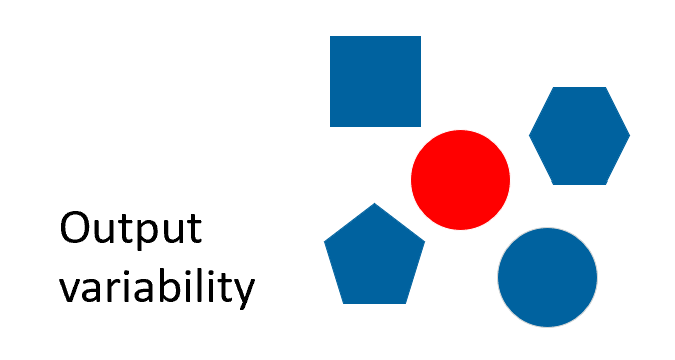 |
- The blue shapes represent the training data.
- The red shape represents the prediction of interest.
This means that you might get low confidence even in the middle of well-predicted training points, if that region shows high output variability.
Conversely, high confidence can appear in distant regions if the model sees low variability and consistent behavior.
Being close to training data does not guarantee high confidence especially if that data had noisy outputs. The model can be uncertain in this region too.
What a Confidence Score is NOT
- A prediction accuracy percentage.
- A guarantee of simulation quality.
- A statistical probability.
- A direct measure of error magnitude.
Interpreting Confidence Scores
| High Confidence (example: 0.98) | Low Confidence (example: 0.40) | |
|---|---|---|
| What it means | The model has seen very similar predictions during training. | This design is somewhat different from what the model was trained on. |
| What it does not mean | The model's prediction is 98% accurate. | The prediction is 40% accurate and should be rejected. |
Best practices
| Do | Do not |
|---|---|
|
|
How Confidence Scores Are Calculated
- 2/3 (0.66) at the 95th percentile of the distribution. This means that 95% of training data have fewer uncertainty and will have a confidence score higher than 0.66 (and 5% lower than 0.66).
- 1 at the 5th percentile of the distribution. This means that 5% of training data have fewer uncertainty and will have a confidence score equal to 1 (and 95% lower than 1).
- Scores below 0.66 are labeled as "Low" confidence as it has a high uncertainty score compared to the scores of the training set.
- Scores above 0.66 are labeled as "High" confidence as it falls within the range of the training set uncertainty scores.
To assess whether the model is truly performing well, it is important to dive into the Model Evaluation Report, which provides more robust metrics like error analysis, parity plots and correlation.
Principle
To better understand the confidence score idea, look at the following Bayesian Optimization. The Ansys SimAI platform confidence score produces an equivalent of the purple value to navigate and give the model confidence on the input geometries for prediction. It is based on the "shortest distance to the closest training data". This distance is then normalized between 0 and 1, and a High/Low threshold is set at 0.66.
Practical Application
- Start with an initial set of simulations.
- Build a model and run predictions.
- Identify areas with low confidence scores.
- Add more training data in those specific regions if they are of interest to you.
- Rebuild the model to improve coverage and confidence.
This iterative approach helps you efficiently develop robust models while minimizing the number of expensive simulations needed.