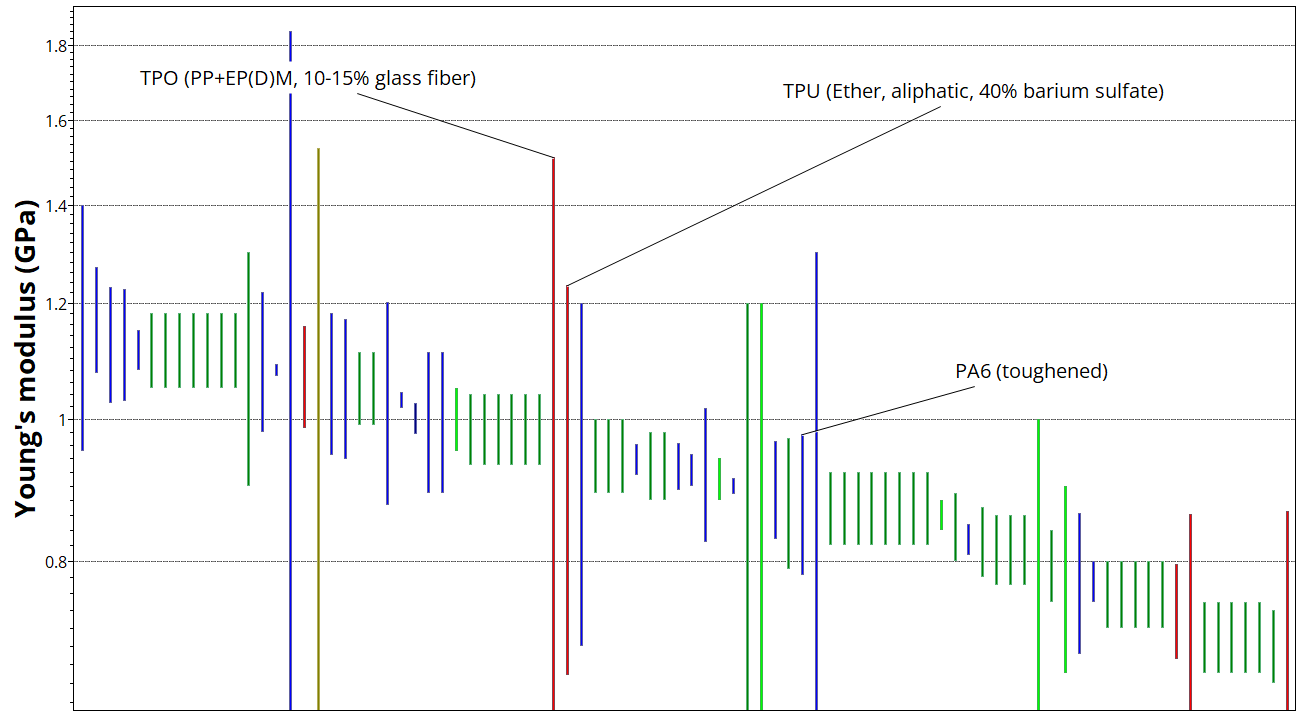
Exercise 5: Create a bar chart
Plot materials data on a bar chart using the Chart/Index Stage.
-
Explore the chart.
Click
 Zoom in and then drag to focus on a specific area of
the chart, and
Zoom in and then drag to focus on a specific area of
the chart, and  Zoom out to return to a wider view.
Click
 Autoscale to zoom back to view the whole chart
again.
Autoscale to zoom back to view the whole chart
again. -
Label records on the chart.
Click a record in the chart and then drag to add and position a new data label.
To delete a data label, select it and press DELETE. To delete all labels in the chart, press CTRL+A and then press DELETE.