Histogram
Plots a histogram with n attributes, or a single attribute with a specified distribution fitted to the data. The maximum number of attributes is 6. The bin width is calculated automatically. If more than one sample is plotted, they will share the same x-axis scale.
| Argument | Description | Data types |
|---|---|---|
| Sample 1 | Attribute which provides the values to be plotted on the X axis. Select the distribution to fit to this data sample from the drop-down list. | Point, Range, Integer |
| Sample n | Attribute which provides the values to be plotted on the X axis. | Point, Range, Integer |
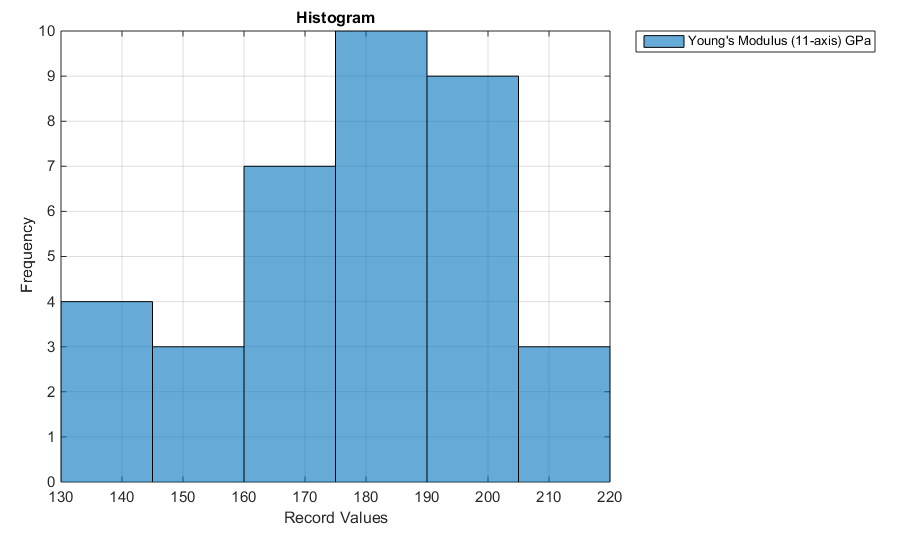
Example: Young's modulus
In this plot:
- X axis = Young's modulus (11-axis)
- Y axis = Record frequency
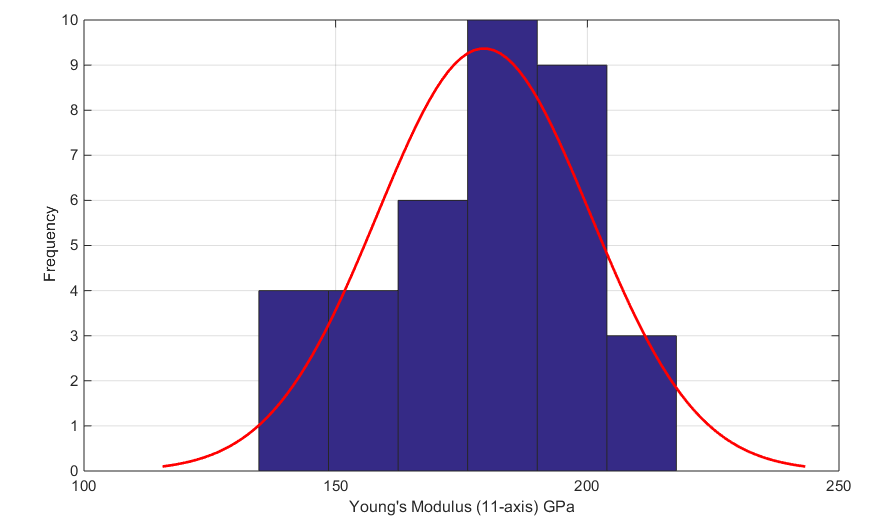
Example: Young's modulus with normal distribution fit
In this plot:
- X axis = Young's modulus (11-axis) with normal distribution fit
- Y axis = Record frequency